Copyright
©The Author(s) 2015.
World J Gastroenterol. May 21, 2015; 21(19): 5893-5900
Published online May 21, 2015. doi: 10.3748/wjg.v21.i19.5893
Published online May 21, 2015. doi: 10.3748/wjg.v21.i19.5893
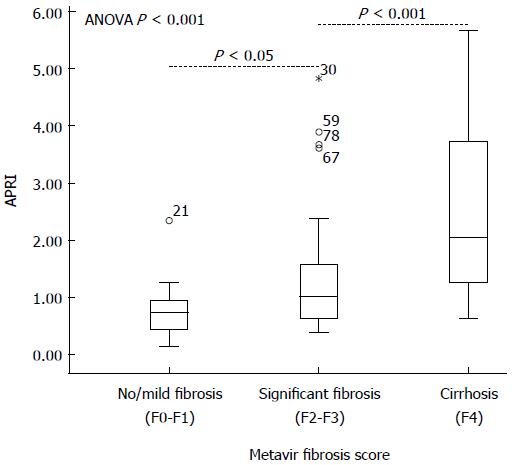
Figure 1 Aminotransferase to platelet ratio index by Metavir score of liver fibrosis in infants with biliary atresia.
Round dots represent values larger than the upper quartile plus 1.5 times the interquartile range. Asterisks represent values larger than the upper quartile plus 3.0 times the interquartile range. Metavir fibrosis scores of F0-F4 were categorized into groups of no/mild fibrosis (F0-F1, n = 25), significant fibrosis (F2-F3, n = 56) and cirrhosis (F4, n = 10). The APRI in the three groups significantly differed from each other by ANOVA analysis (P < 0.001).
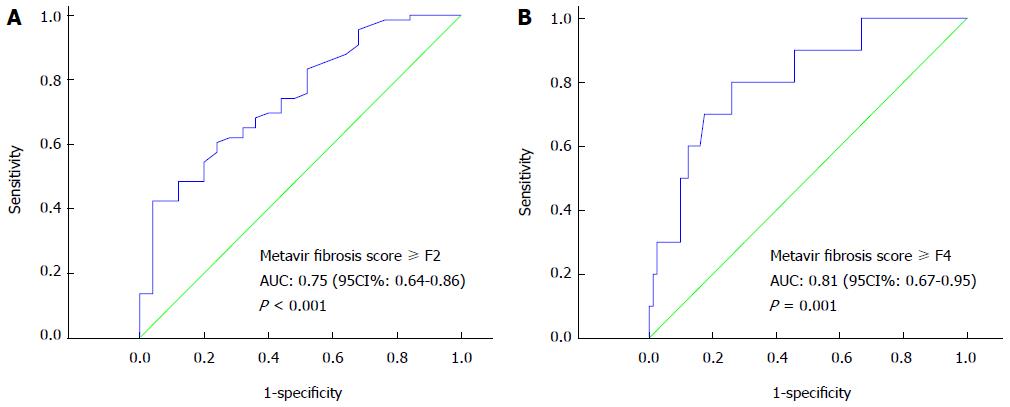
Figure 2 Receiver-operating characteristics curve for aminotransferase to platelet ratio index in the diagnosis of significant liver fibrosis or cirrhosis in biliary atresia.
A: Receiver-operating characteristics (ROC) curve of F0-F1 vs F2-F4. The area under the ROC curve (AUC) of APRI for diagnosing significant fibrosis (≥ F2) was 0.75 (95%CI: 0.64-0.86, P < 0.001); B: ROC curve of F0-F3 vs F4. The area under the ROC curve (AUC) of APRI for diagnosing liver cirrhosis (= F4) was 0.81 (95%CI: 0.67-0.96, P = 0.001).
- Citation: Yang LY, Fu J, Peng XF, Pang SY, Gao KK, Chen ZR, He LJ, Wen Z, Wang H, Li L, Wang FH, Yu JK, Xu Y, Gong ST, Xia HM, Liu HY. Validation of aspartate aminotransferase to platelet ratio for diagnosis of liver fibrosis and prediction of postoperative prognosis in infants with biliary atresia. World J Gastroenterol 2015; 21(19): 5893-5900
- URL: https://www.wjgnet.com/1007-9327/full/v21/i19/5893.htm
- DOI: https://dx.doi.org/10.3748/wjg.v21.i19.5893


