Copyright
©The Author(s) 2015.
World J Gastroenterol. May 14, 2015; 21(18): 5647-5653
Published online May 14, 2015. doi: 10.3748/wjg.v21.i18.5647
Published online May 14, 2015. doi: 10.3748/wjg.v21.i18.5647
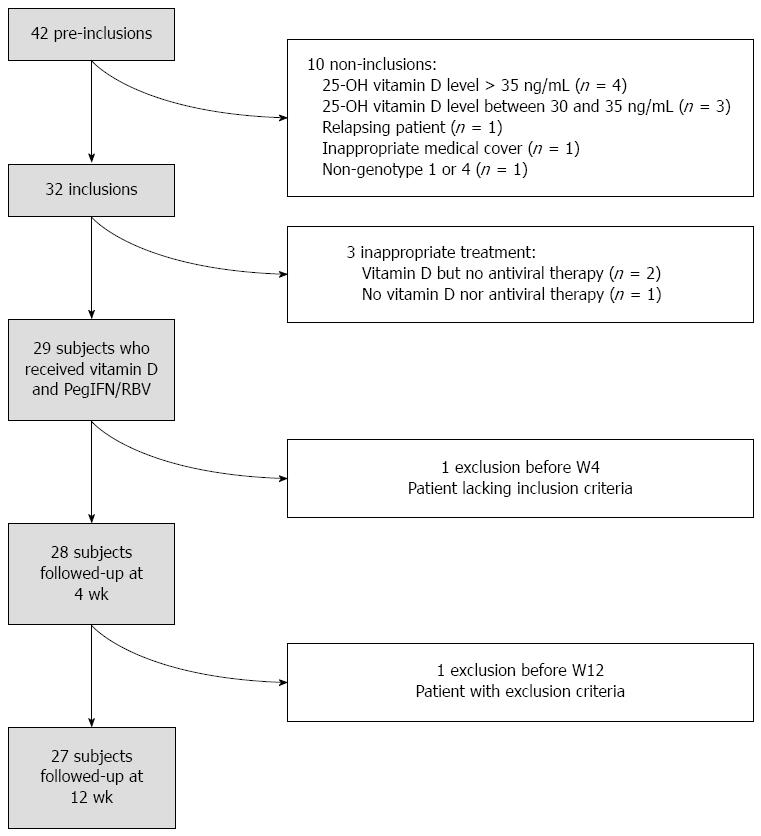
Figure 1 Flow chart of the study.
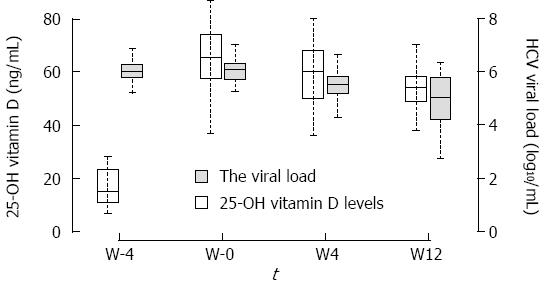
Figure 2 Change in viral load (log10/mL) and 25-OH vitamin D (ng/mL) from W-4 to W12.
- Citation: Terrier B, Lapidus N, Pol S, Serfaty L, Ratziu V, Asselah T, Thibault V, Souberbielle JC, Carrat F, Cacoub P. Vitamin D in addition to peg-interferon-alpha/ribavirin in chronic hepatitis C virus infection: ANRS-HC25-VITAVIC study. World J Gastroenterol 2015; 21(18): 5647-5653
- URL: https://www.wjgnet.com/1007-9327/full/v21/i18/5647.htm
- DOI: https://dx.doi.org/10.3748/wjg.v21.i18.5647


