Copyright
©The Author(s) 2015.
World J Gastroenterol. May 14, 2015; 21(18): 5582-5590
Published online May 14, 2015. doi: 10.3748/wjg.v21.i18.5582
Published online May 14, 2015. doi: 10.3748/wjg.v21.i18.5582
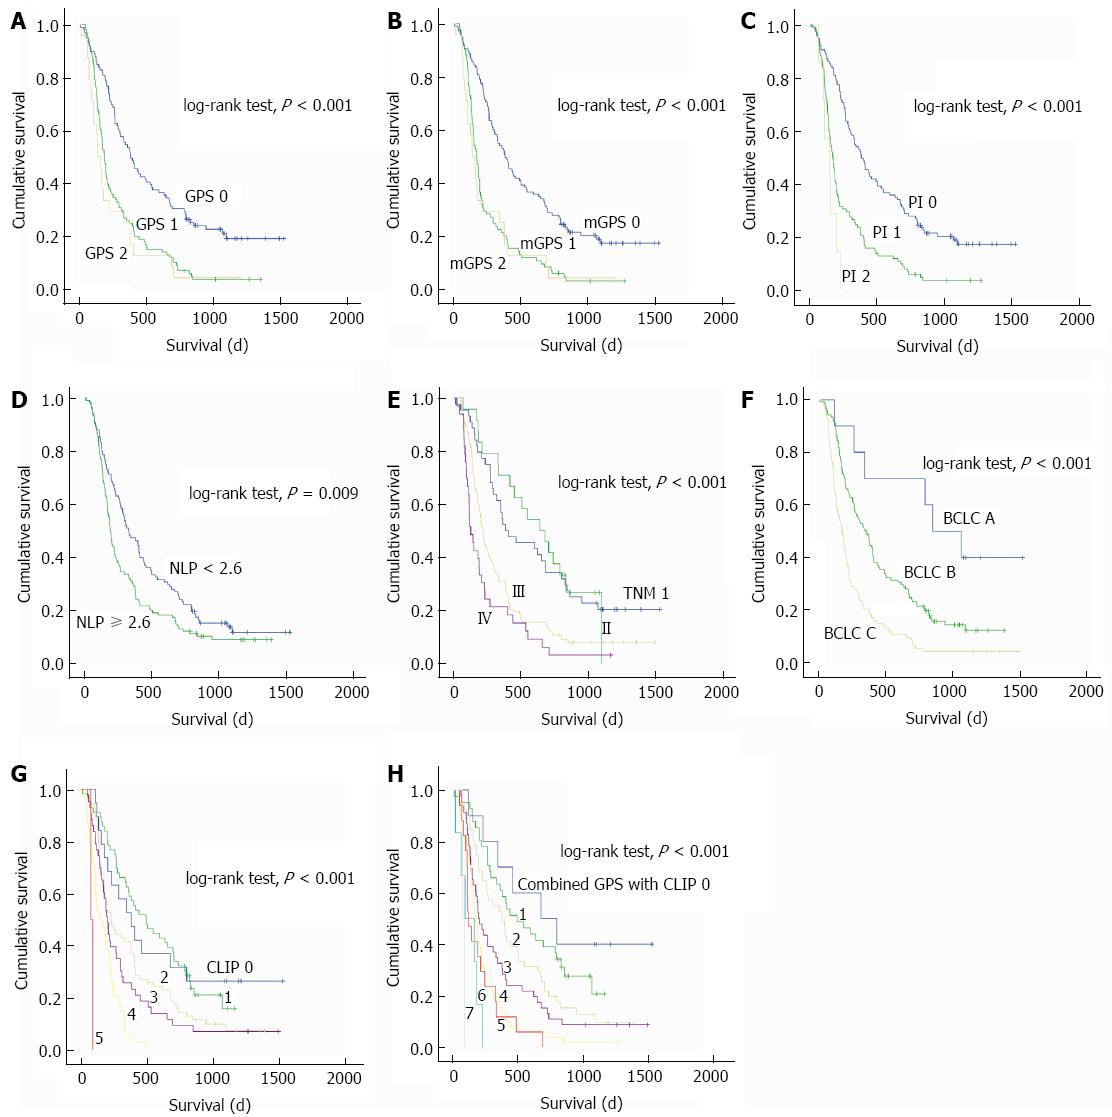
Figure 1 Kaplan-Meier survival curves for overall survival in 224 patients undergoing transarterial chemoembolization for hepatocellular carcinoma.
A: Glasgow Prognostic Score (GPS); B: Modified GPS (mGPS); C: Prognostic Index (PI); D: Neutrophil-lymphocyte ratio (NLR); E: Tumor-node-metastasis (TNM); F: Barcelona Clinic Liver Cancer (BCLC); G: Cancer of the Liver Italian Program (CLIP); H: Combined score of the GPS and CILP.
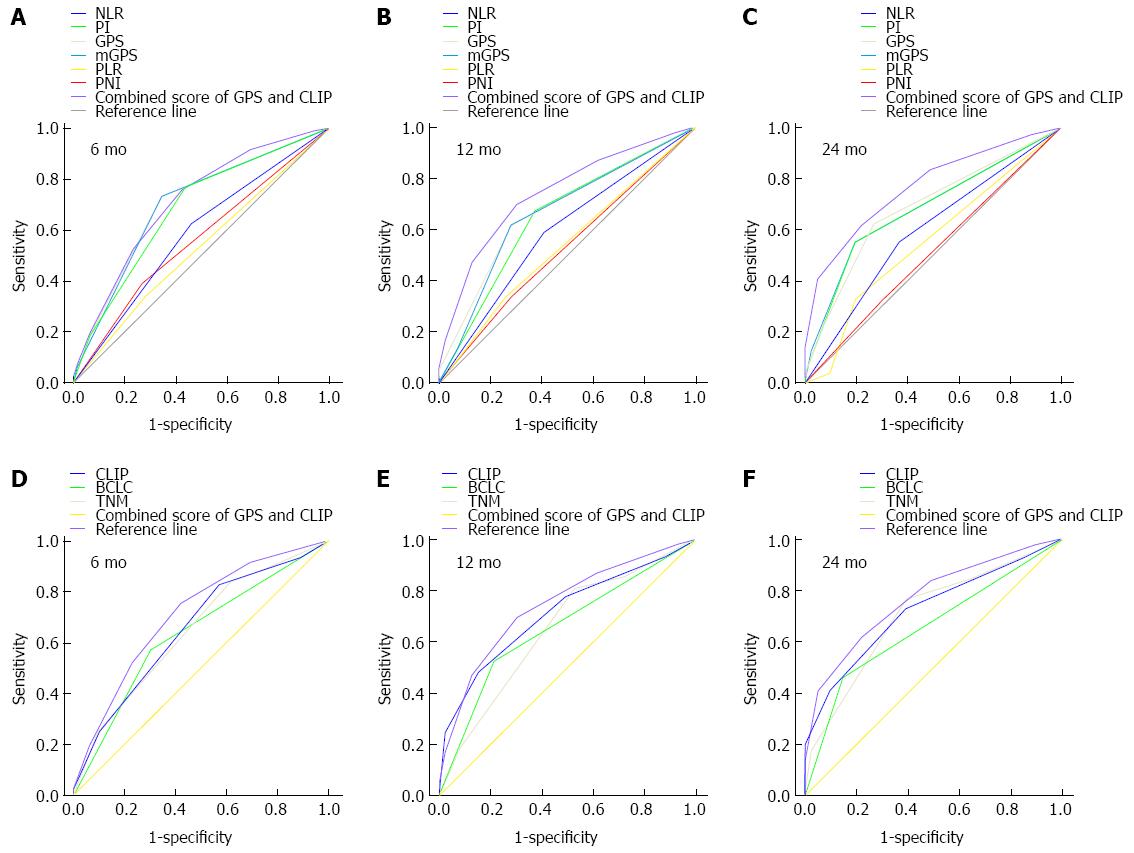
Figure 2 Comparisons of the area under the curve for outcome prediction.
Comparisons among the inflammation scores, staging systems, and combined score of the Glasgow Prognostic Score (GPS) and Cancer of the Liver Italian Program (CLIP) at A, D: 6 mo; B, E: 12 mo; and C, F: 24 mo in patients with hepatocellular carcinoma after transarterial chemoembolization. BCLC: Barcelona Clinic Liver Cancer; mGPS: Modified Glasgow Prognostic Score; NLR: Neutrophil-lymphocyte ratio; PI: Prognostic Index; PLR: Platelet-lymphocyte ratio; PNI: Prognostic Nutritional Index; TNM: Tumor-node-metastasis.
- Citation: Zhou DS, Xu L, Luo YL, He FY, Huang JT, Zhang YJ, Chen MS. Inflammation scores predict survival for hepatitis B virus-related hepatocellular carcinoma patients after transarterial chemoembolization. World J Gastroenterol 2015; 21(18): 5582-5590
- URL: https://www.wjgnet.com/1007-9327/full/v21/i18/5582.htm
- DOI: https://dx.doi.org/10.3748/wjg.v21.i18.5582


