Copyright
©The Author(s) 2015.
World J Gastroenterol. Apr 28, 2015; 21(16): 5072-5080
Published online Apr 28, 2015. doi: 10.3748/wjg.v21.i16.5072
Published online Apr 28, 2015. doi: 10.3748/wjg.v21.i16.5072
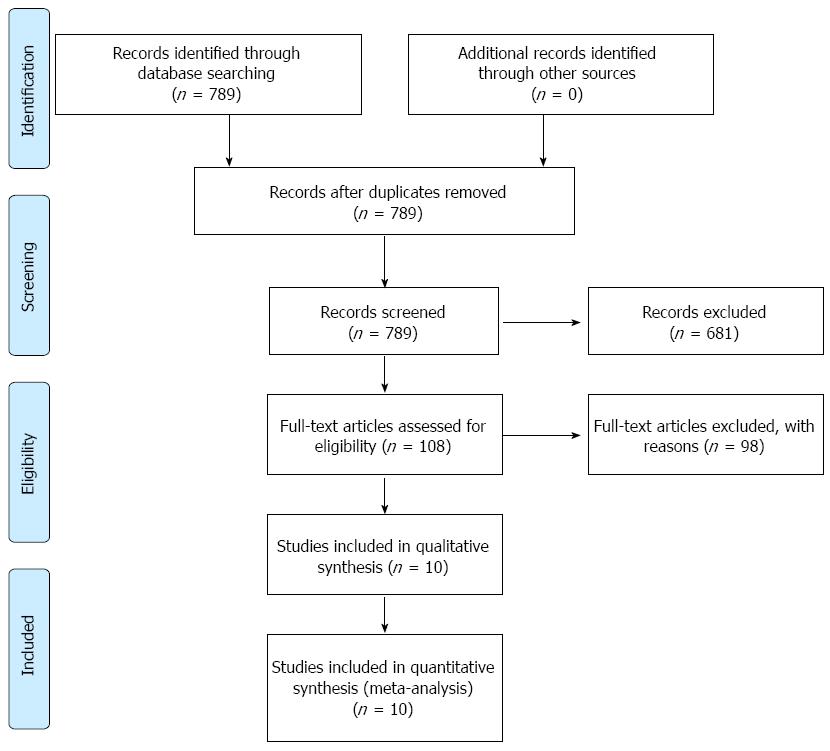
Figure 1 Flow chart: The number of articles in each step.
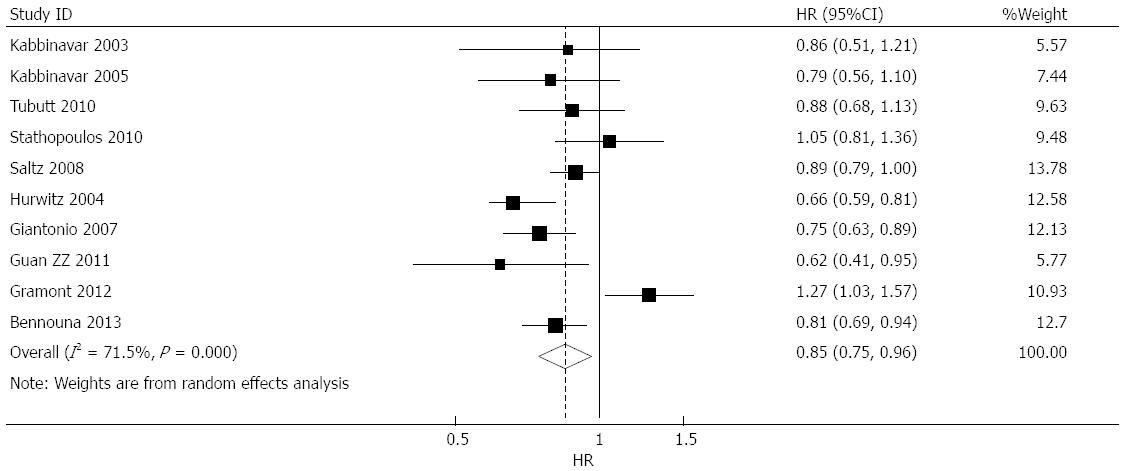
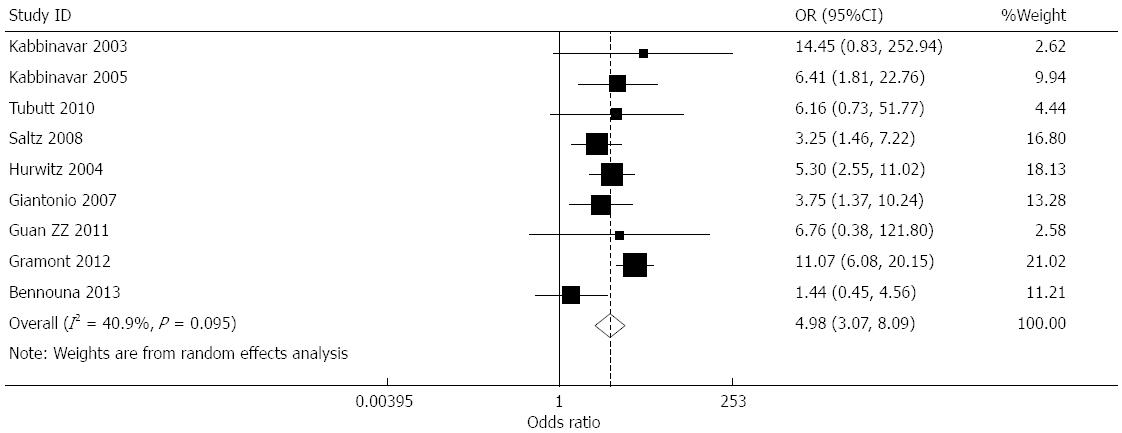
Figure 2 Forest plot of meta-analysis: Effect of bevacizumab on overall survival.
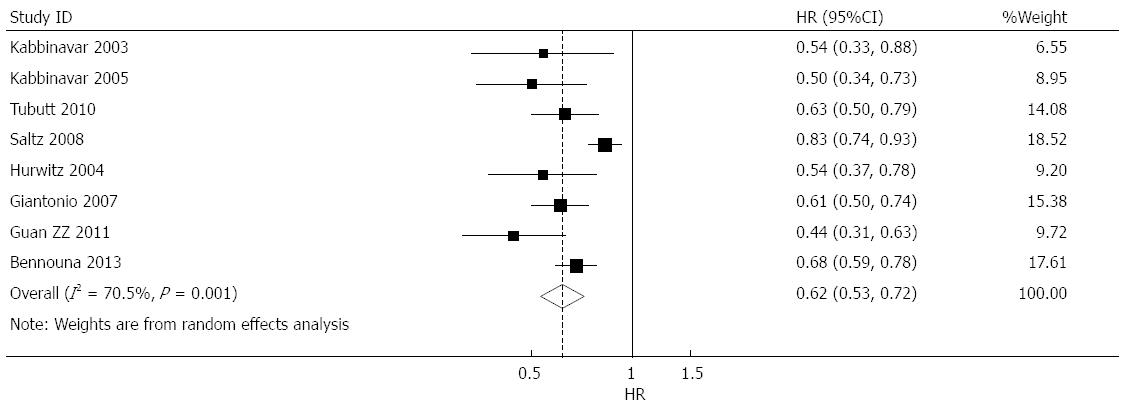
Figure 3 Forest plot of meta-analysis: Effect of bevacizumab on progression-free survival.
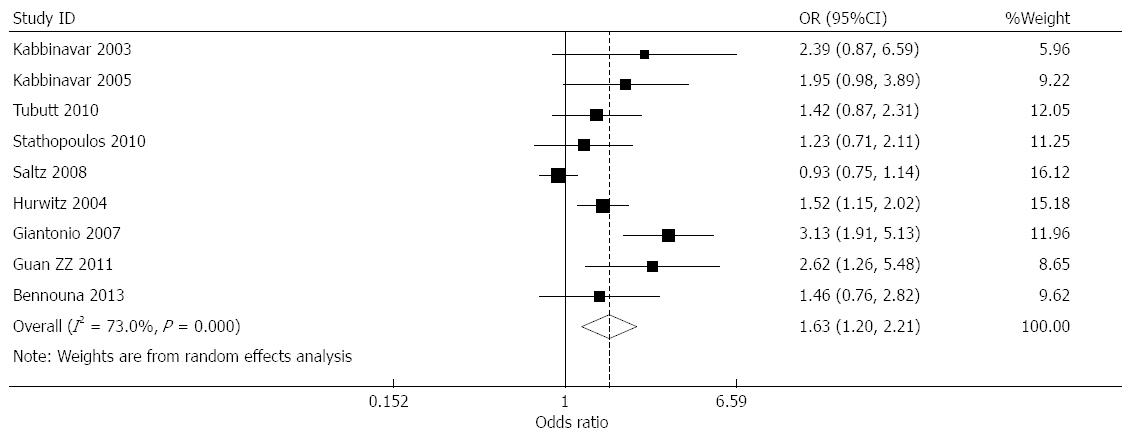
Figure 4 Forest plot of meta-analysis: Effect of bevacizumab on overall response rate.
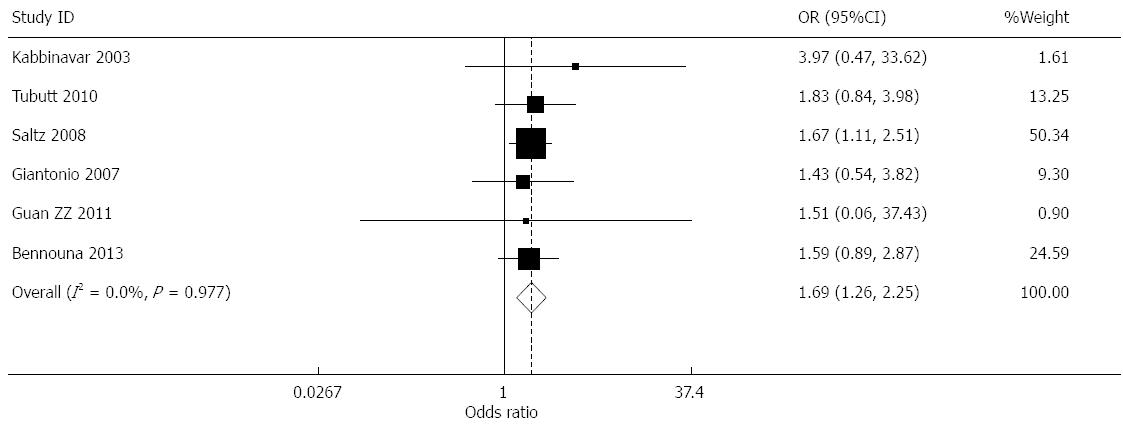
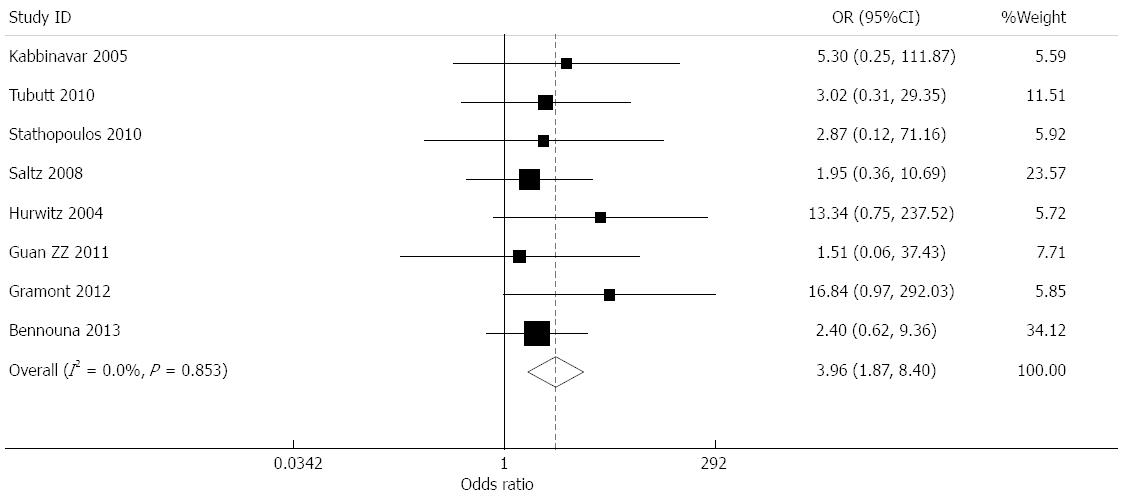
Figure 5 Forest plot of meta-analysis: Effect of bevacizumab on grade ≥ 3 hypertension.
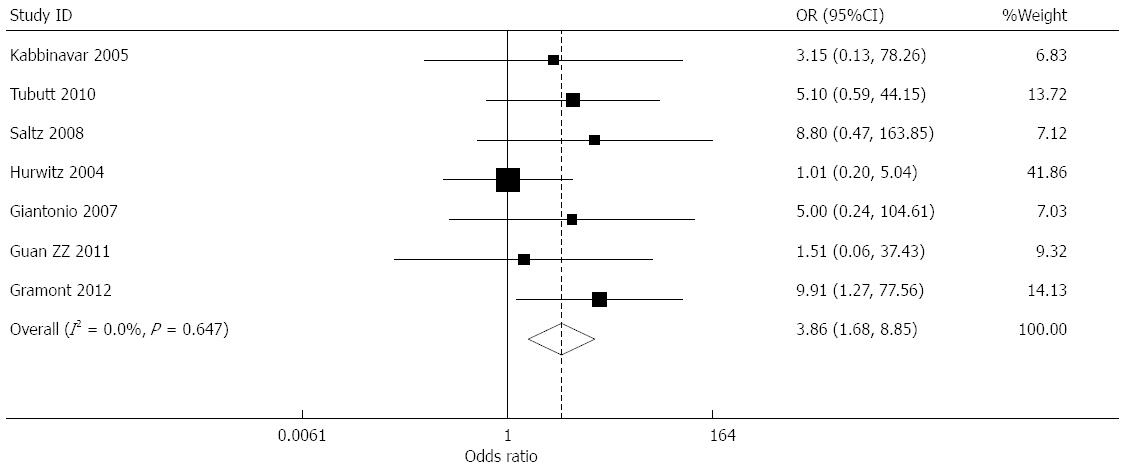
Figure 6 Forest plot of meta-analysis: Effect of bevacizumab on grade ≥ 3 proteinuria.
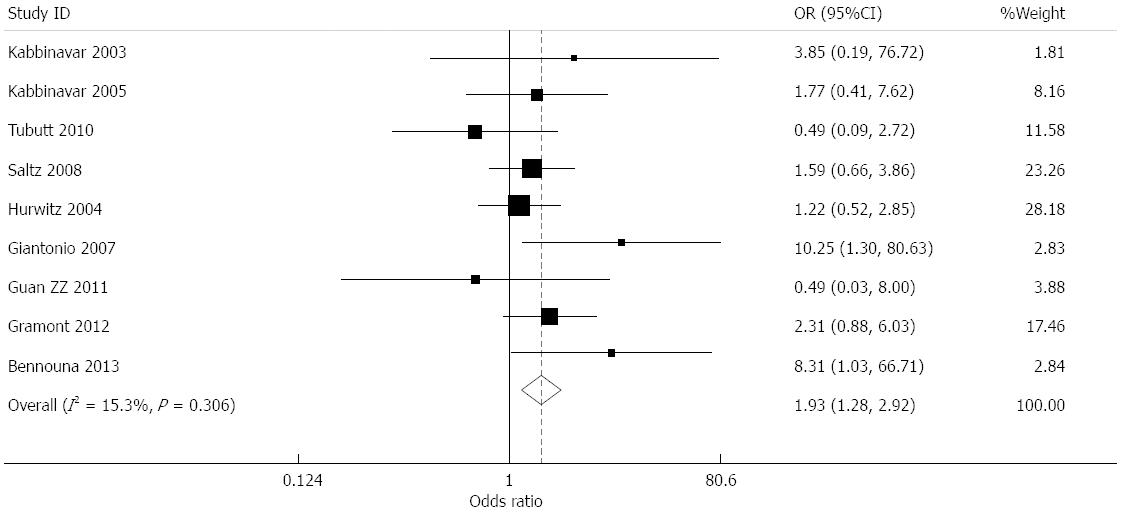
Figure 7 Forest plot of meta-analysis: Effect of bevacizumab on grade ≥ 3 bleeding.
Figure 8 Forest plot of meta-analysis: Effect of bevacizumab on grade ≥ 3 thrombosis.
Figure 9 Forest plot of meta-analysis: Effect of bevacizumab on gastrointestinal perforation.
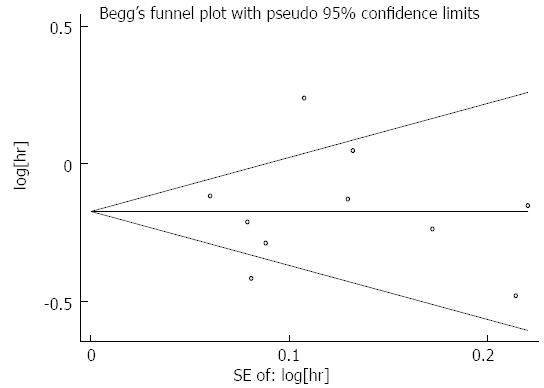
Figure 10 Assessment of publication bias.
All studies are evenly distributed on both sides, thus presenting basic symmetry and indicating that there was no publication bias in the 10 reports.
- Citation: Qu CY, Zheng Y, Zhou M, Zhang Y, Shen F, Cao J, Xu LM. Value of bevacizumab in treatment of colorectal cancer: A meta-analysis. World J Gastroenterol 2015; 21(16): 5072-5080
- URL: https://www.wjgnet.com/1007-9327/full/v21/i16/5072.htm
- DOI: https://dx.doi.org/10.3748/wjg.v21.i16.5072


