Copyright
©The Author(s) 2015.
World J Gastroenterol. Apr 14, 2015; 21(14): 4323-4333
Published online Apr 14, 2015. doi: 10.3748/wjg.v21.i14.4323
Published online Apr 14, 2015. doi: 10.3748/wjg.v21.i14.4323
Figure 1 Flowchart of study selection.
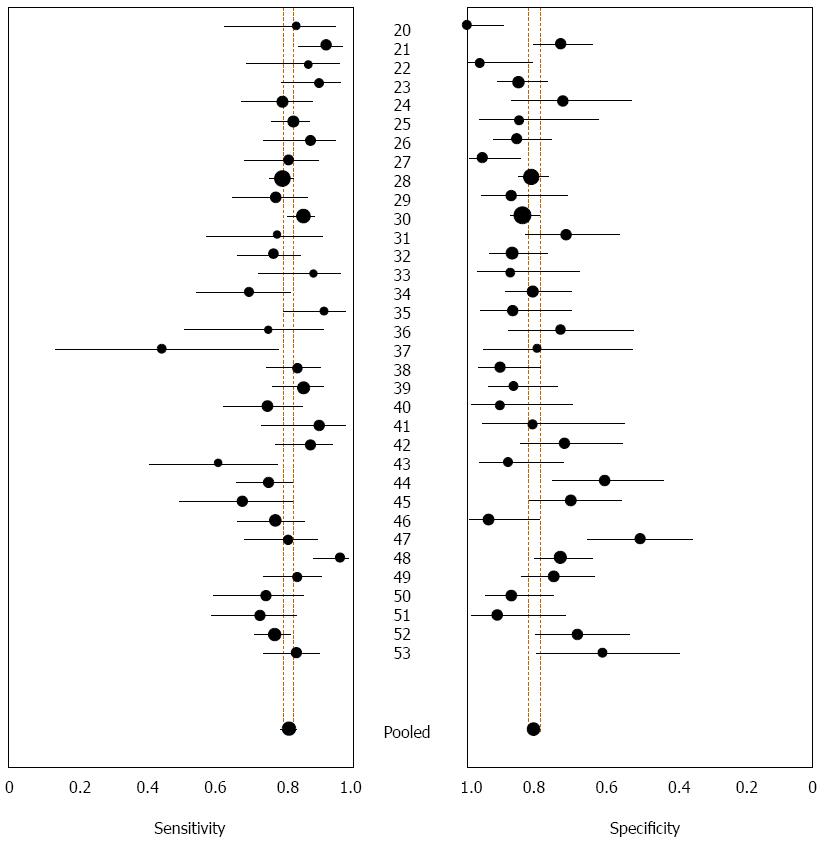
Figure 2 Forest plot showing sensitivity and specificity of carbohydrate antigen 19-9 in the diagnosis of pancreatic carcinoma.
The point estimates of sensitivity and specificity from each study are shown as solid circles. Horizontal error bars indicate 95%CI. Numbers between the plots refer to references. Pooled estimates for the serum carbohydrate antigen 19-9 assay were 0.81 for sensitivity (95%CI: 0.80-0.83) and 0.81 for specificity (95%CI: 0.79-0.82).
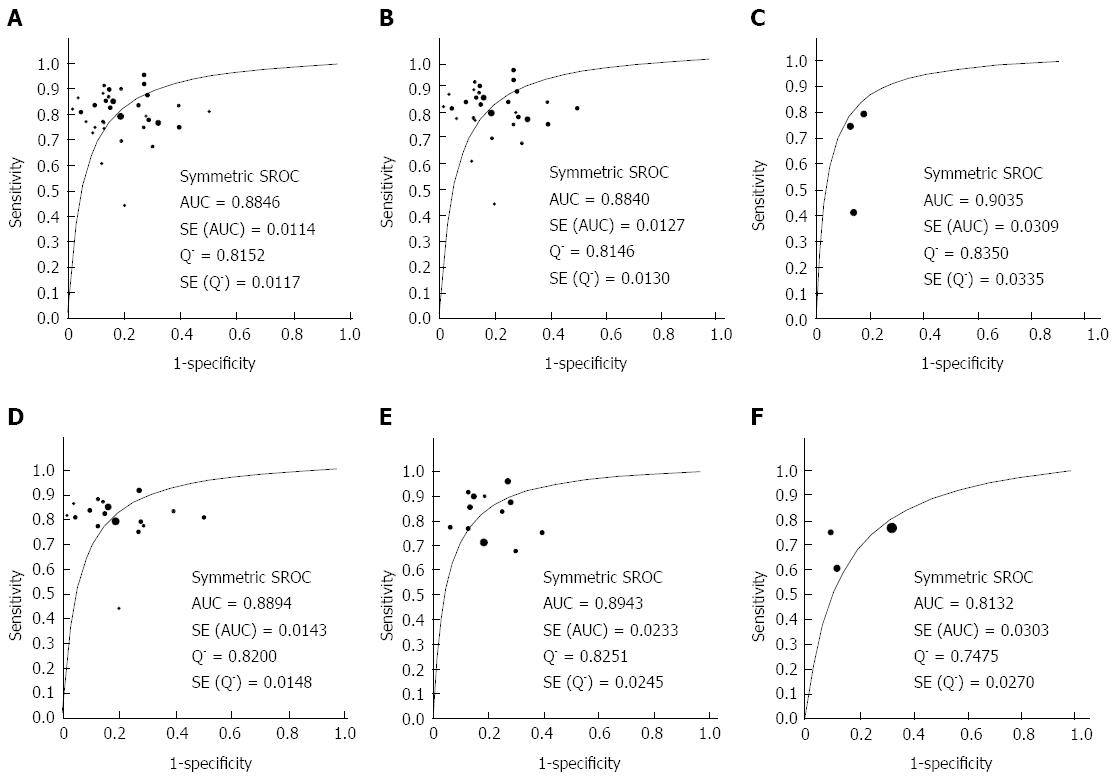
Figure 3 Summary receiver operating characteristic curves for carbohydrate antigen 19-9 assays for differential diagnosis of pancreatic carcinoma and chronic pancreatitis.
Solid circles represent each study included in the meta-analysis, with circle size proportional to the number of participants in the study. SROC curves summarize the overall diagnostic accuracy for all included studies (A), studies using a cut-off of 37 U/mL carbohydrate antigen 19-9 (CA19-9) (B), studies using a cut-off of 100 U/mL CA19-9 (C), studies based on the radioimmunoassay method to assay CA19-9 (D), studies based on the ELISA method (E), and studies based on the enzyme immunoassay method (F). ELISA: Enzyme-linked immunosorbent assay; SROC: Summary receiver operating characteristic.
- Citation: Su SB, Qin SY, Chen W, Luo W, Jiang HX. Carbohydrate antigen 19-9 for differential diagnosis of pancreatic carcinoma and chronic pancreatitis. World J Gastroenterol 2015; 21(14): 4323-4333
- URL: https://www.wjgnet.com/1007-9327/full/v21/i14/4323.htm
- DOI: https://dx.doi.org/10.3748/wjg.v21.i14.4323


