Copyright
©The Author(s) 2015.
World J Gastroenterol. Mar 21, 2015; 21(11): 3317-3324
Published online Mar 21, 2015. doi: 10.3748/wjg.v21.i11.3317
Published online Mar 21, 2015. doi: 10.3748/wjg.v21.i11.3317
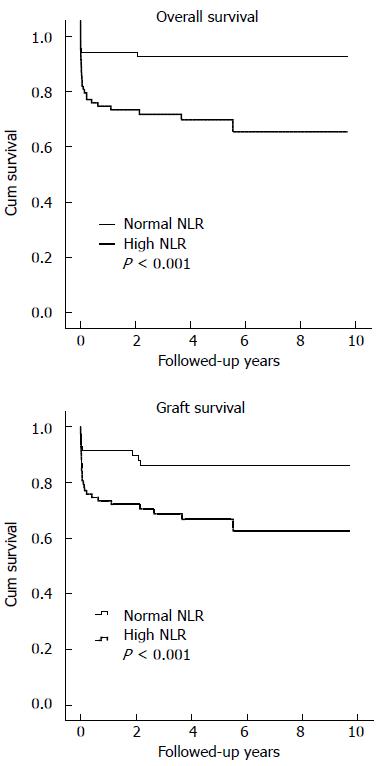
Figure 1 Kaplan-Meier results for overall survival and graft survival for patients classified according to their preoperative neutrophil-lymphocyte ratios.
NLR: Neutrophil-lymphocyte ratio.
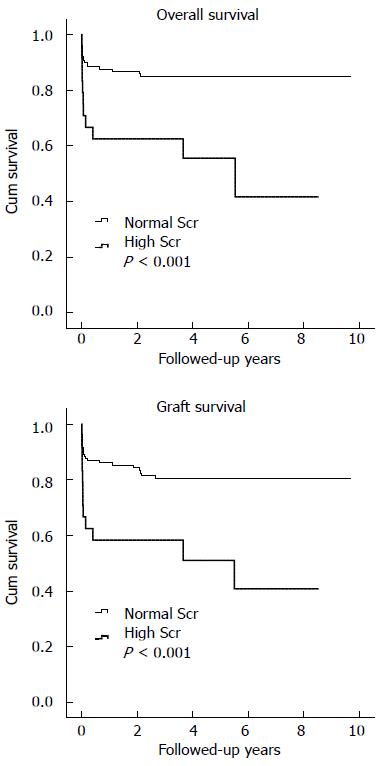
Figure 2 Kaplan-Meier results for overall survival and graft survival for patients classified according to their preoperative serum creatinine.
Scr: Serum creatinine.
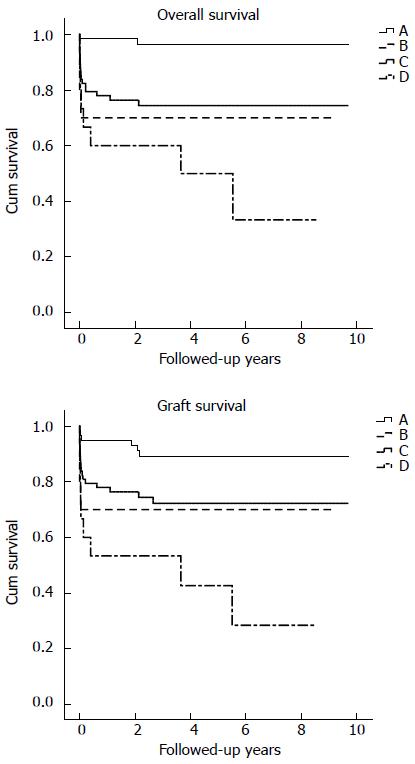
Figure 3 Kaplan-Meier results for overall survival and graft survival for patients with high serum creatinine and high neutrophil-lymphocyte ratios.
The 1-, 3- and 5-year overall survival rates, respectively, were 98.4%, 96.4% and 96.4% in the A group (NLR < 4.6 and normal Scr), 66.7%, 66.7% and 66.7% in the B group (NLR < 4.6 and high Scr), 77.9%, 74.4% and 74.4% in the C group (NLR ≥ 4.6 and normal Scr), 60.0%, 60.0% and 50.0% in the D group (NLR ≥ 4.6 and high Scr). NLR: Neutrophil-lymphocyte ratio; Scr: Serum creatinine.
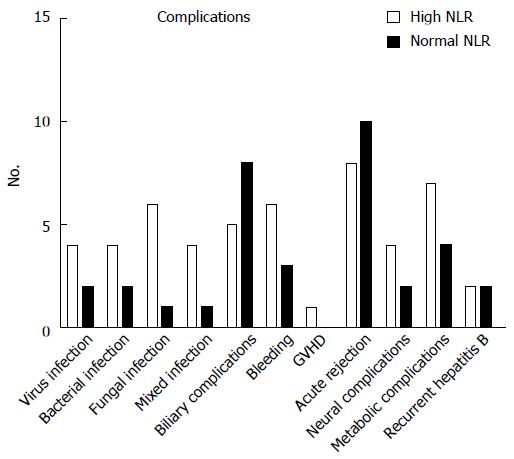
Figure 4 Incidence of postoperative complications in patients and the relationship between complications and neutrophil-lymphocyte ratio.
NLR: Neutrophil-lymphocyte ratio; GVHD: Graft-vs-host disease.
- Citation: Lin BY, Zhou L, Geng L, Zheng ZY, Jia JJ, Zhang J, Yao J, Zheng SS. High neutrophil-lymphocyte ratio indicates poor prognosis for acute-on-chronic liver failure after liver transplantation. World J Gastroenterol 2015; 21(11): 3317-3324
- URL: https://www.wjgnet.com/1007-9327/full/v21/i11/3317.htm
- DOI: https://dx.doi.org/10.3748/wjg.v21.i11.3317


