Copyright
©The Author(s) 2015.
World J Gastroenterol. Mar 21, 2015; 21(11): 3291-3299
Published online Mar 21, 2015. doi: 10.3748/wjg.v21.i11.3291
Published online Mar 21, 2015. doi: 10.3748/wjg.v21.i11.3291
Figure 1 Expression levels of iron-metabolism-related genes in hepatitis C virus-infected liver in each genotype.
The levels were measured by real-time reverse transcription polymerase chain reaction. aP < 0.05 vs genotype1b, bP < 0.01 vs genotype1b, cP < 0.05 vs control, dP < 0.01 vs control.
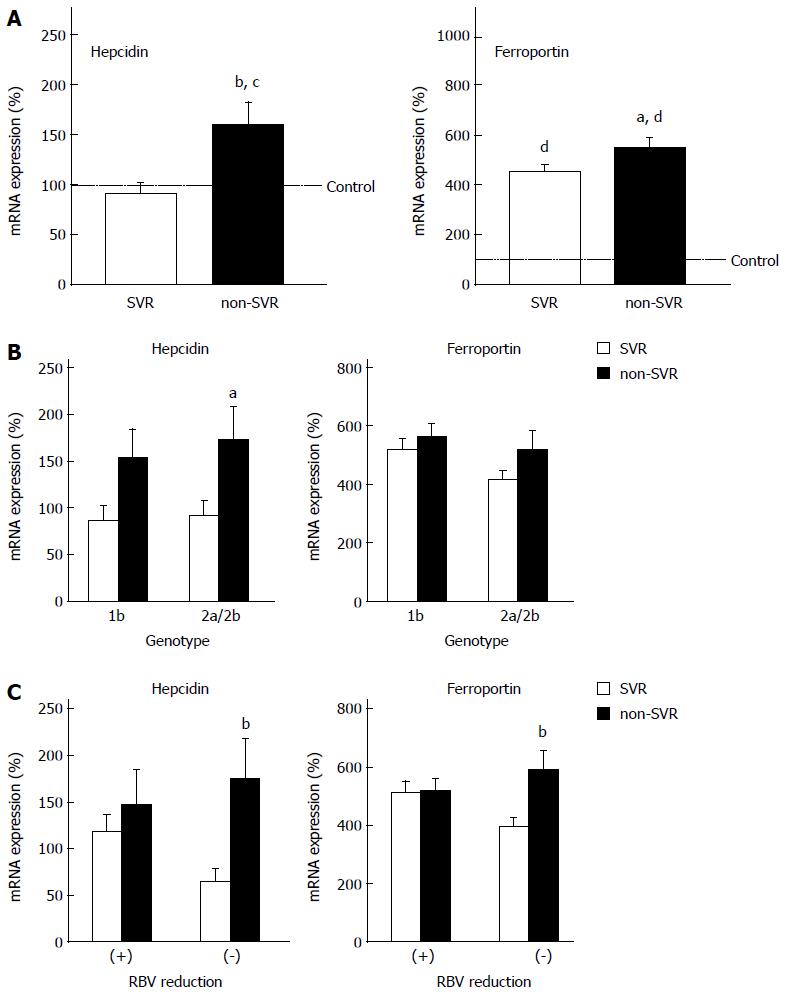
Figure 2 Expression levels of hepcidin and ferroportin genes.
A: Sustained virological response (SVR) vs non-SVR; B: Genotype 1b vs 2a/2b; C: RBV dose reduction (+) vs (−). The levels were measured by real-time reverse transcription polymerase chain reaction. aP< 0.05 vs SVR, bP < 0.01 vs SVR, cP < 0.05 vs control, dP < 0.01 vs control.
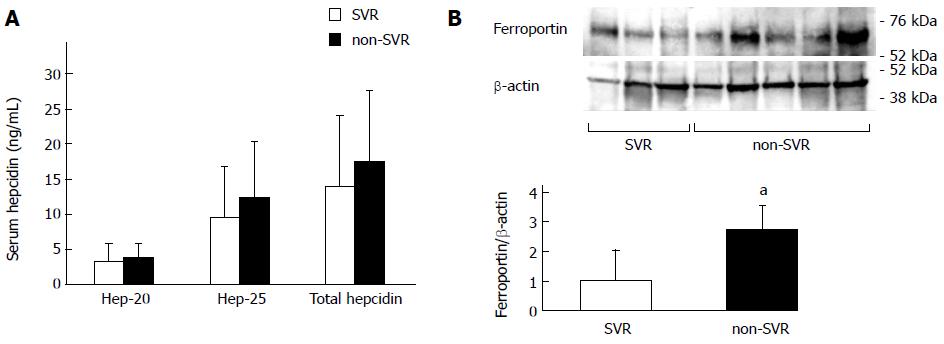
Figure 3 Protein expression of hepcidin and ferroportin.
A: Serum hepcidin levels measured by sensitive liquid chromatography/electrospray ionization tandem mass spectrometry (total hepcidin and its two isoforms, Hep-20 and Hep 25); B: Ferroportin levels in the liver measured by Western blotting. aP < 0.05 vs sustained virological response (SVR).
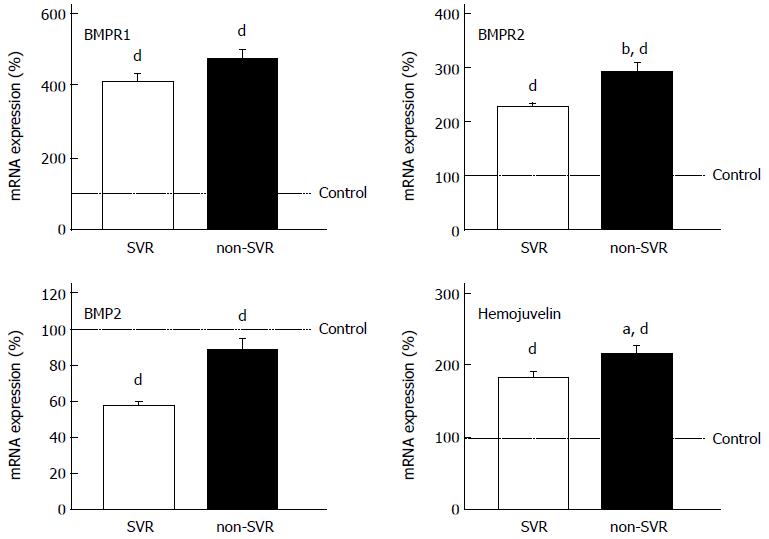
Figure 4 Expression levels of genes regulating hepcidin expression.
The levels were measured by real-time reverse transcription polymerase chain reaction. aP < 0.05 vs sustained virological response (SVR), bP < 0.01 vs SVR, dP < 0.01 vs control.
- Citation: Kohjima M, Yoshimoto T, Enjoji M, Fukushima N, Fukuizumi K, Nakamura T, Kurokawa M, Fujimori N, Sasaki Y, Shimonaka Y, Murata Y, Koyama S, Kawabe K, Haraguchi K, Sumida Y, Harada N, Kato M, Kotoh K, Nakamuta M. Hepcidin/ferroportin expression levels involve efficacy of pegylated-interferon plus ribavirin in hepatitis C virus-infected liver. World J Gastroenterol 2015; 21(11): 3291-3299
- URL: https://www.wjgnet.com/1007-9327/full/v21/i11/3291.htm
- DOI: https://dx.doi.org/10.3748/wjg.v21.i11.3291


