Copyright
©The Author(s) 2015.
World J Gastroenterol. Jan 7, 2015; 21(1): 342-350
Published online Jan 7, 2015. doi: 10.3748/wjg.v21.i1.342
Published online Jan 7, 2015. doi: 10.3748/wjg.v21.i1.342
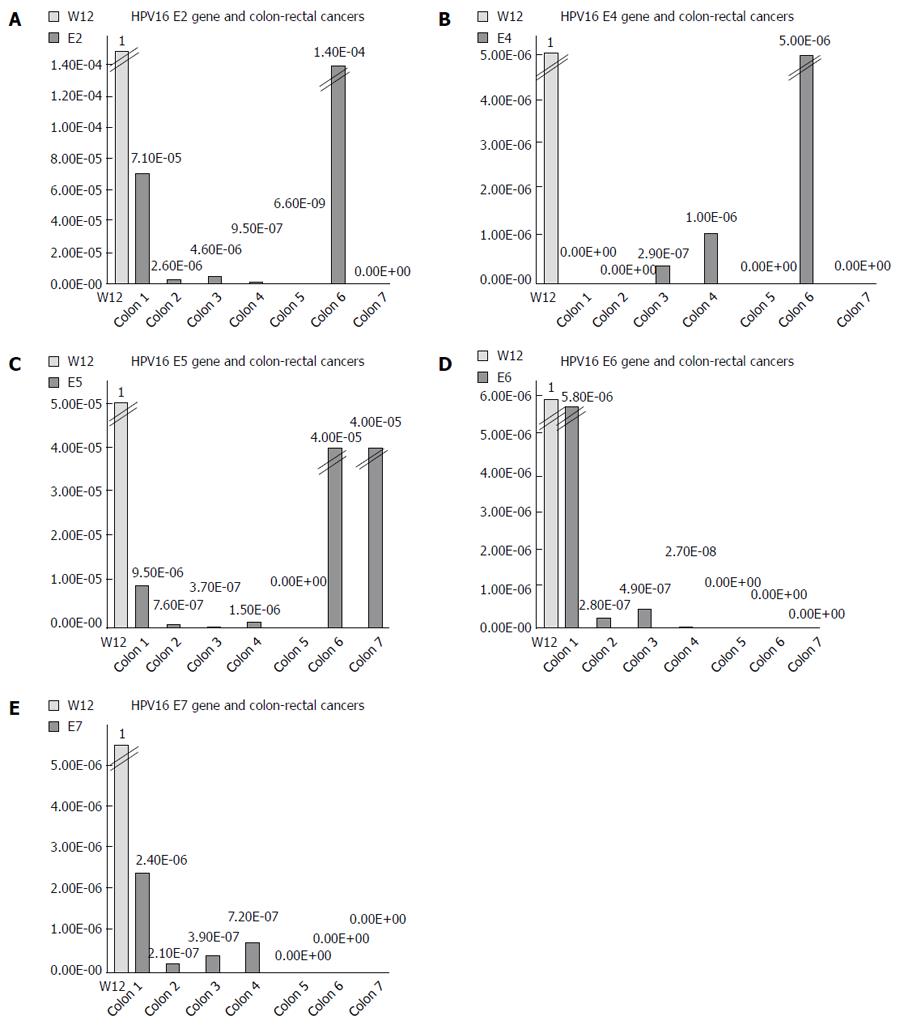
Figure 1 Human papillomavirus 16 relative gene quantifications.
Data obtained in human papillomavirus (HCV) 16 positive colorectal cancer tissues through real time polymerase chain reaction analysis by the ΔΔCT method, with W12 cells as a reference considered equal to 1. Primer sequences were as follows: A: E2: For GCAACGAAGTATCCTCTCCTG; Rev GCGA CGGCTTTGGTATGG; B: E4: For AATTATTAGGCAGCACTTGG; Rev GTCGTCTGTGTTTC TTCG; C: E5: For CGCTGCTTTTGTCTGTGTCT; Rev GCGTGCATGTGTATGTATTAAAAA; D: E6: For GCACCAAAAGAGAACTGCAATGTT; Rev AGTCATATACCTCACGTCGCGCA GTCA; E: E7: For CAAGTGTGACTCTACGCTTCGG; Rev GTGGCCCATTAACAGGTCTTC CAA. β-actin: For TCACCCACACTGTGCCCATCTACGA; Rev CAGCGGAACCGCTCAT TGCCAATGG. The thermal cycler conditions were: 95 °C for 3 min, followed by 40 cycles of 95 °C for 10 s and 60 °C for 30 s, followed by a melting curve starting at 55 °C.
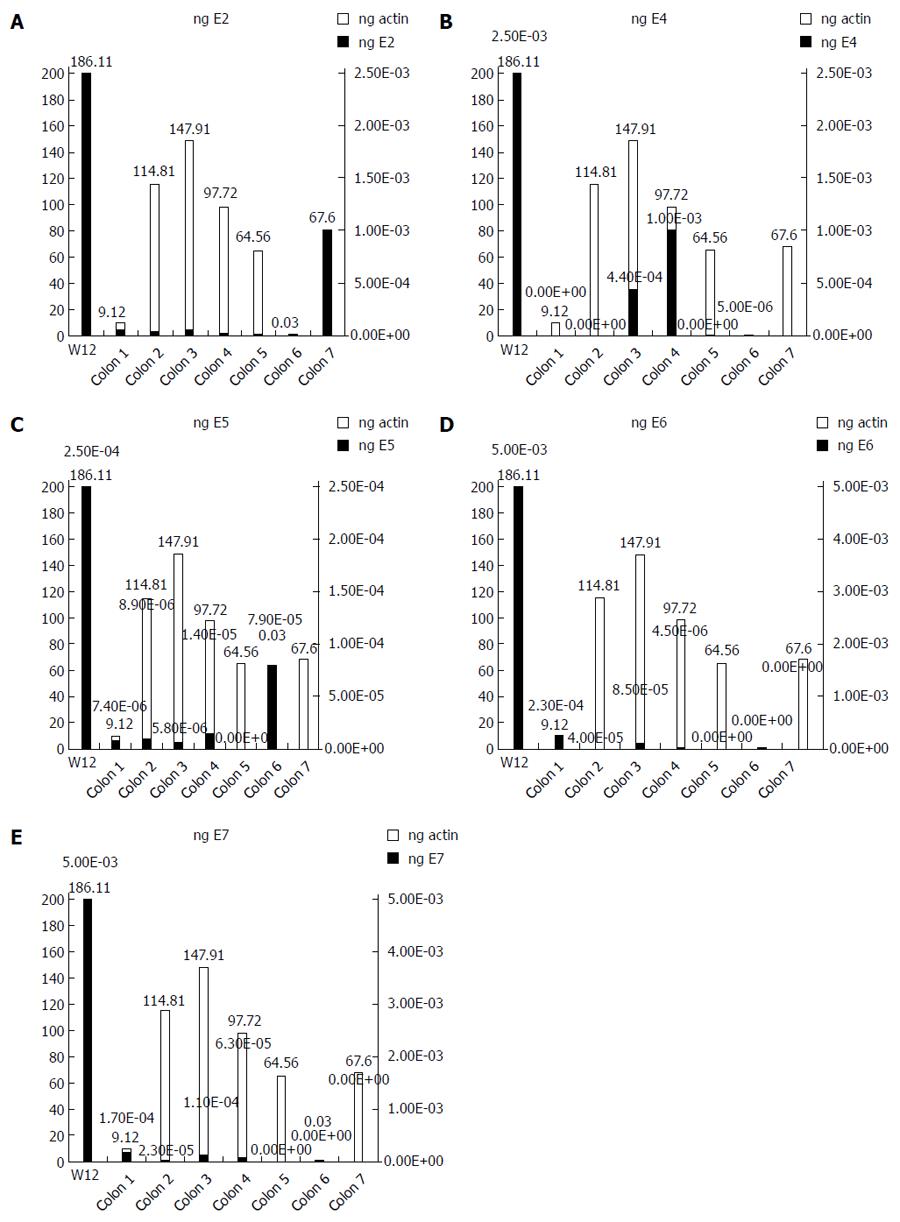
Figure 2 Human papillomavirus 16 gene ng quantifications.
A: E2 ng; B: E4 ng; C: E5 ng; D: E6 ng; E: E7 ng. Data obtained through real time polymerase chain reaction analysis, showing ng quantification of the house-keeping beta actin gene (white bars) and human papillomavirus (HPV) 16 genes (grey bars) in W12 cells and in HPV16-positive colorectal cancers.
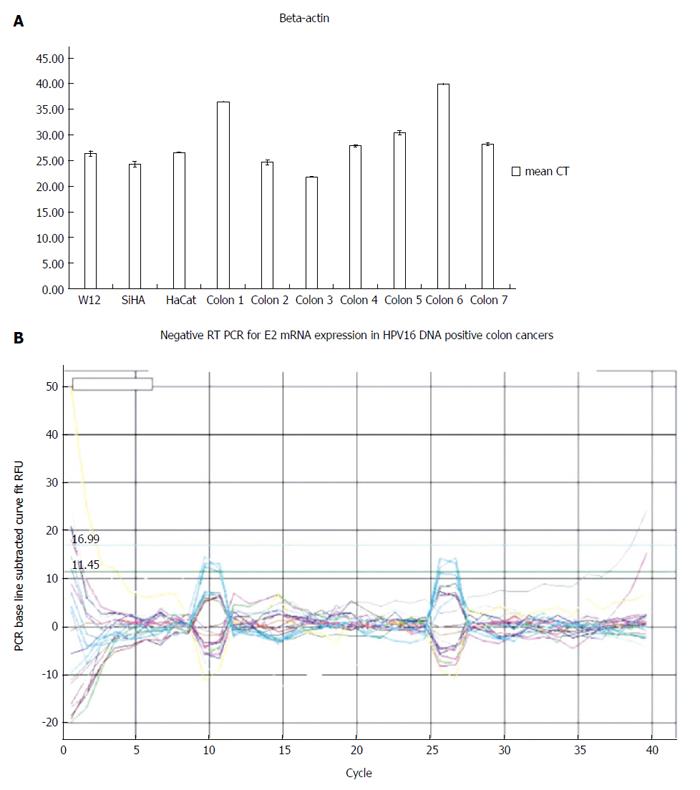
Figure 3 mRNA expression in cell lines and colorectal cancers.
A: Beta-actin mRNA levels: Quantitative real-time polymerase chain reaction (q-RT PCR) cycle thresholds (CTs) in cell lines and colorectal cancerous tissues; B: Negative RT PCR for human papillomavirus (HPV) E2 mRNA level in HPV-positive colorectal tissues.
- Citation: Lorenzon L, Mazzetta F, Pilozzi E, Uggeri G, Torrisi MR, Ferri M, Ziparo V, French D. Human papillomavirus does not have a causal role in colorectal carcinogenesis. World J Gastroenterol 2015; 21(1): 342-350
- URL: https://www.wjgnet.com/1007-9327/full/v21/i1/342.htm
- DOI: https://dx.doi.org/10.3748/wjg.v21.i1.342


