Copyright
©2014 Baishideng Publishing Group Co.
World J Gastroenterol. Feb 28, 2014; 20(8): 2051-2061
Published online Feb 28, 2014. doi: 10.3748/wjg.v20.i8.2051
Published online Feb 28, 2014. doi: 10.3748/wjg.v20.i8.2051
Figure 1 Experimental design of the study.
Feces, blood and tissue collection are indicated (dark blue) in the grid. DSS: Dextran sulfate sodium.
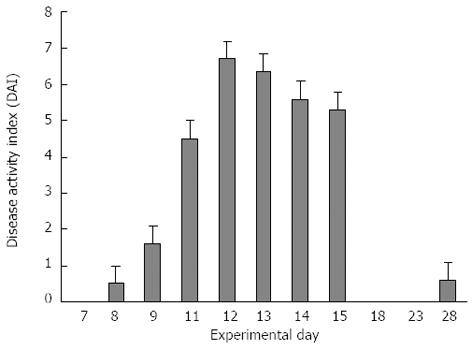
Figure 2 Disease activity index score of colitis in 1.
5% dextran sulfate sodium-treated mice. At day 28, an average disease activity index (DAI) score of 0.5 is still present.
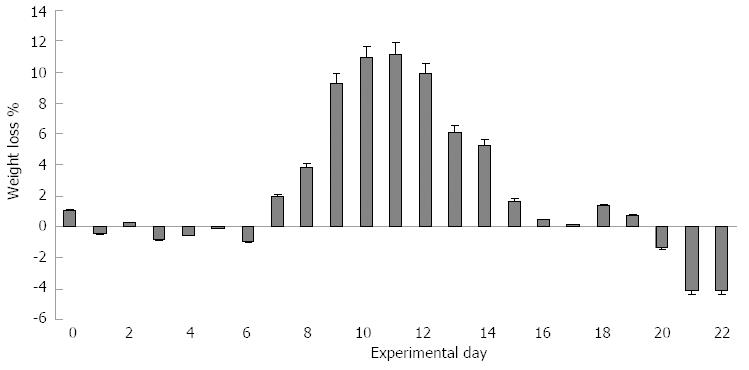
Figure 3 Weight loss in dextran sulphate sodium-treated mice.
The maximum weight loss (11%) was recorded between days 9 and 12. Weight recovery ended at days 19-20.
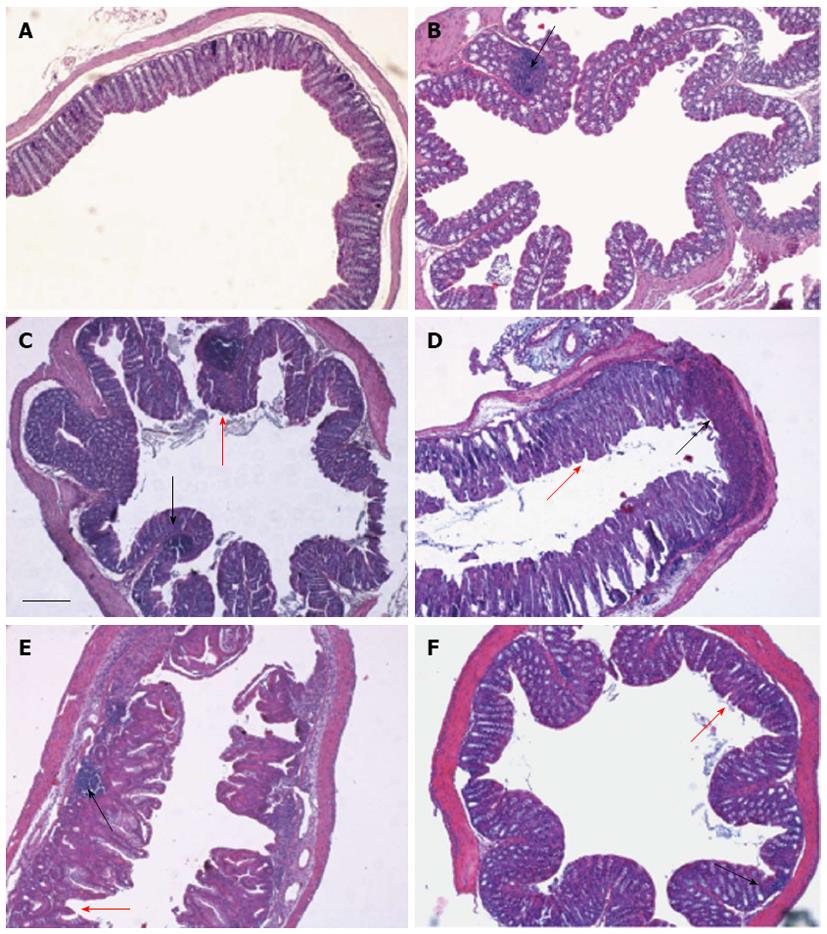
Figure 4 Differences in histological parameters during experimental colitis.
Colons were collected from DSS-treated mice on days 3 (B), 7 (C) 13 (D), 19 (E) and 29 (F). In comparison to control mice (A), histopathological changes in individual crypts are shown in representative hematoxylin and eosin-stained sections. Loss of crypt architecture associated with epithelial damage and flattened villi (red arrows) and leukocyte infiltration (black arrows) are evident following DSS treatment (bar = 200 μm).
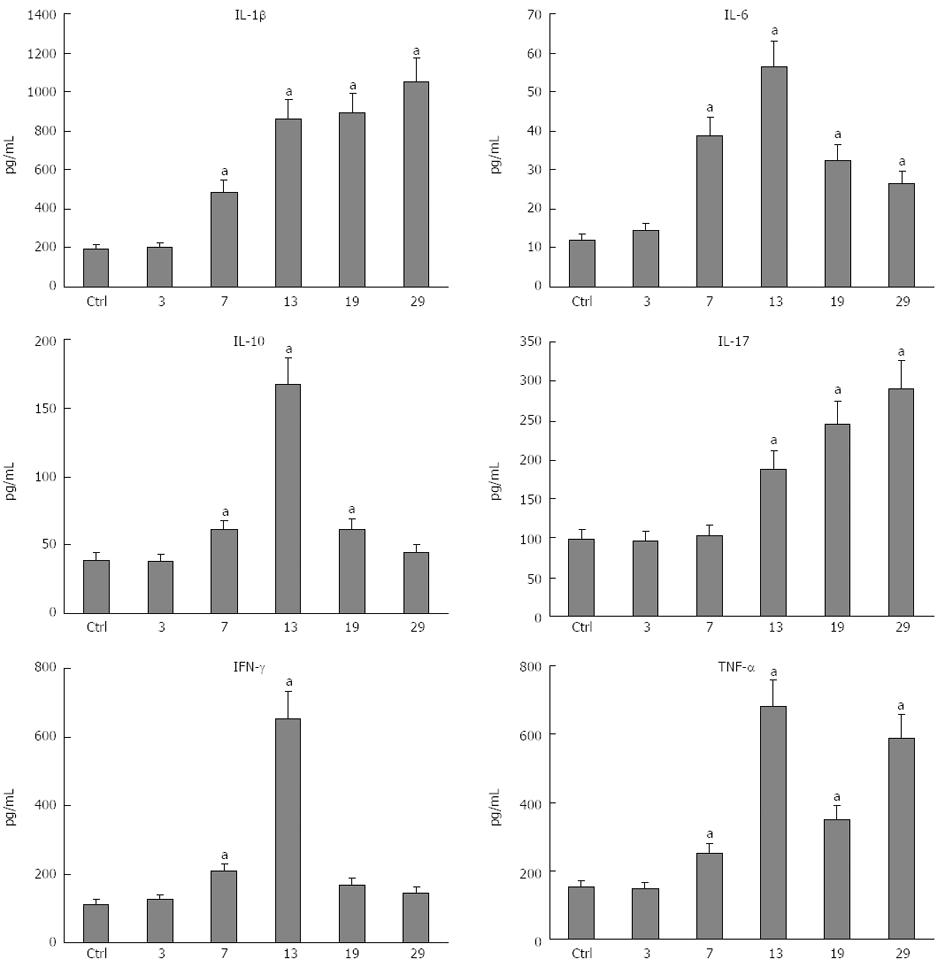
Figure 5 Plasma cytokine variations during experimental colitis.
Data are expressed as mean ± SEM of at least three animals. aP≤ 0.05 with respect to controls.
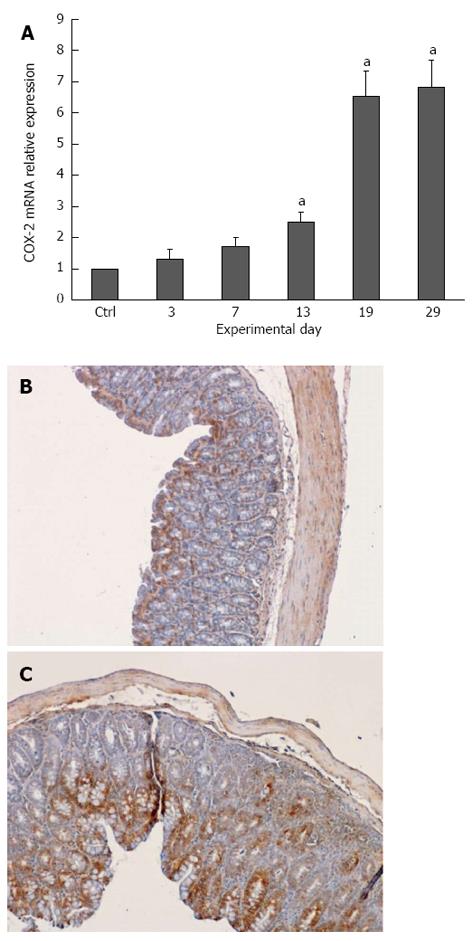
Figure 6 Evaluation of cyclooxygenase-2 mRNA during dextran sulfate sodium-induced colitis.
On days 3, 7, 13, 19 and 29 colon tissue was collected and processed for real-time PCR. The COX-2 mRNA significantly increased during the recovery phase (A). aP≤ 0.05 vs control. Immunohistochemical analysis confirmed that COX-2 expression is limited to the apical mucosa in healthy mice (B), while it is increased and spreads over the entire thickness of the mucosa at day 29 (C).
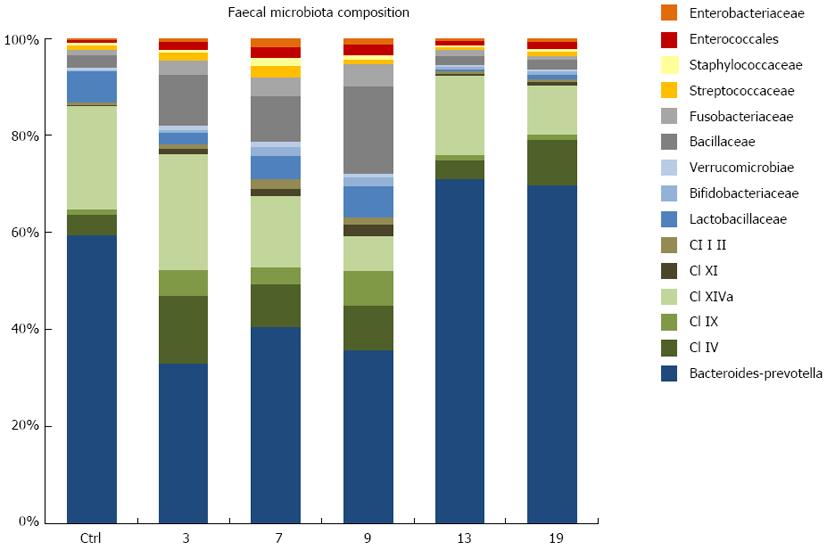
Figure 7 Temporal dynamics of the fecal microbial community of dextran sulfate sodium-treated mice and healthy controls.
Cl: Clostridium cluster.
- Citation: Fazio LD, Cavazza E, Spisni E, Strillacci A, Centanni M, Candela M, Praticò C, Campieri M, Ricci C, Valerii MC. Longitudinal analysis of inflammation and microbiota dynamics in a model of mild chronic dextran sulfate sodium-induced colitis in mice. World J Gastroenterol 2014; 20(8): 2051-2061
- URL: https://www.wjgnet.com/1007-9327/full/v20/i8/2051.htm
- DOI: https://dx.doi.org/10.3748/wjg.v20.i8.2051


