Copyright
©2014 Baishideng Publishing Group Co.
World J Gastroenterol. Feb 7, 2014; 20(5): 1371-1376
Published online Feb 7, 2014. doi: 10.3748/wjg.v20.i5.1371
Published online Feb 7, 2014. doi: 10.3748/wjg.v20.i5.1371
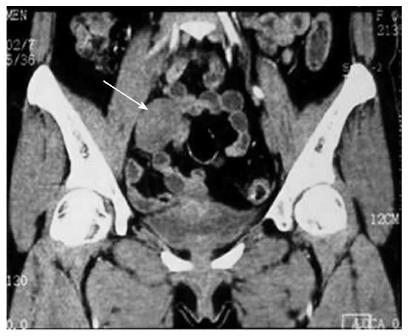
Figure 1 Computed tomography scan of the abdomen revealing a well-circumscribed mass (arrow) with isodensity located distal to the appendix.
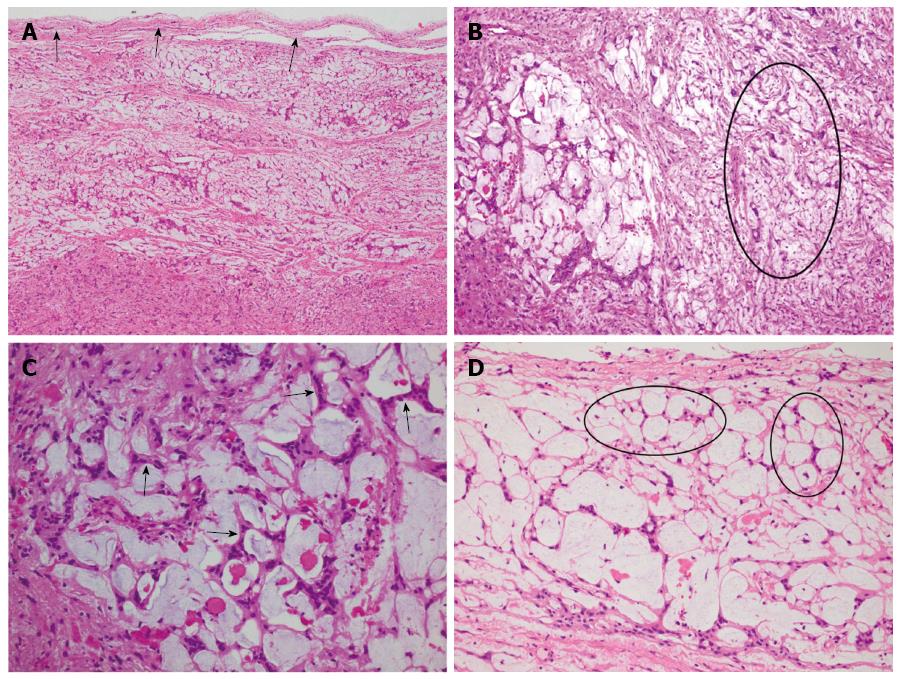
Figure 2 Pathological findings (Hematoxylin-eosin staining).
A: Low power showing a thin fibrous capsule at the periphery (arrow) (× 20); B: Prominently myxoid areas (ellipse) (× 40); C: High magnification illustrating lacelike (arrow) (× 200); and D: Microcystic (ellipse) (× 100) arrangement of tumor cells.
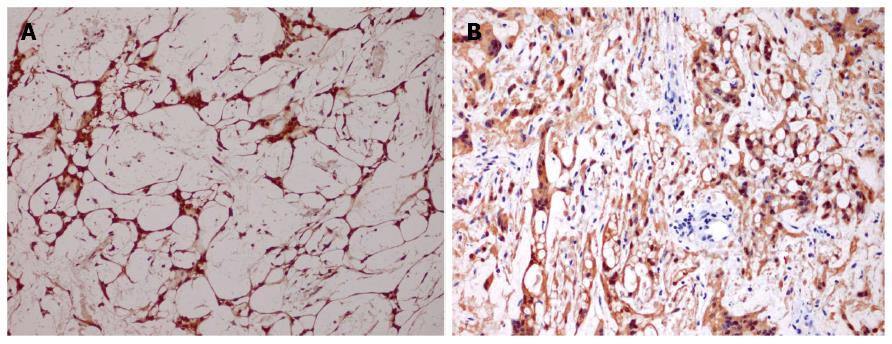
Figure 3 Immunohistochemical staining (EnVision method).
A: S100 protein (× 100); B: Protein gene product 9.5 (× 100).
- Citation: Tang SX, Sun YH, Zhou XR, Wang J. Bowel mesentery (meso-appendix) microcystic/reticular schwannoma: Case report and literature review. World J Gastroenterol 2014; 20(5): 1371-1376
- URL: https://www.wjgnet.com/1007-9327/full/v20/i5/1371.htm
- DOI: https://dx.doi.org/10.3748/wjg.v20.i5.1371


