Copyright
©2014 Baishideng Publishing Group Inc.
World J Gastroenterol. Dec 21, 2014; 20(47): 18031-18037
Published online Dec 21, 2014. doi: 10.3748/wjg.v20.i47.18031
Published online Dec 21, 2014. doi: 10.3748/wjg.v20.i47.18031
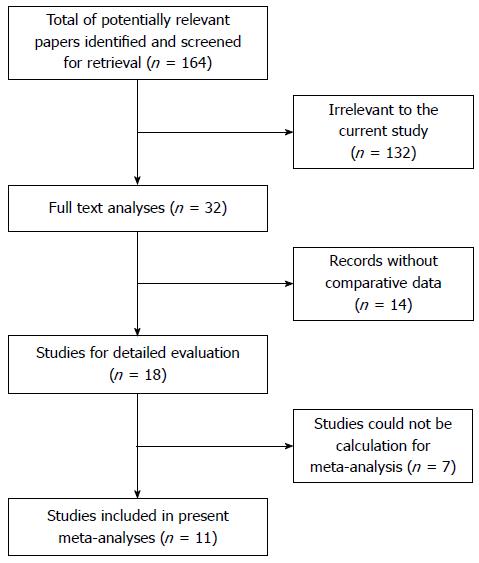
Figure 1 Flow chart of study selection.
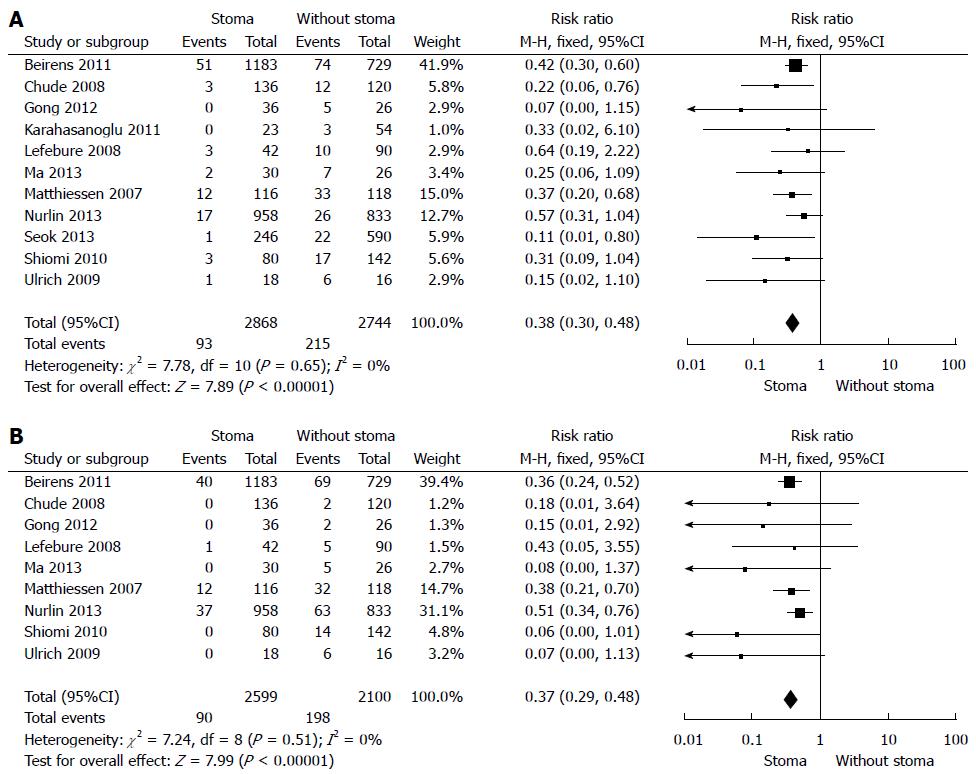
Figure 2 Forest plot.
A: Forest plot for a comparison of the study outcomes of low anterior resection with or without stoma vs anastomotic leakage; B: Forest plot of the study outcomes of low anterior resection with or without stoma vs reoperation rate. Risk ratios are shown with 95%CIs.
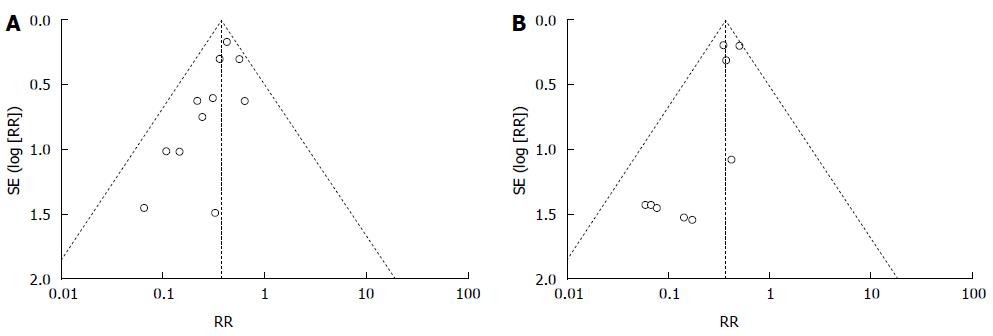
Figure 3 Funnel plot.
A: Funnel plot for the publication bias test of outcomes of low anterior resection with or without stoma vs anastomotic leakage; B: Funnel plot for the publication bias test regarding outcomes of low anterior resection with or without stoma vs reoperation rate. RR: Risk ratio.
- Citation: Wu SW, Ma CC, Yang Y. Role of protective stoma in low anterior resection for rectal cancer: A meta-analysis. World J Gastroenterol 2014; 20(47): 18031-18037
- URL: https://www.wjgnet.com/1007-9327/full/v20/i47/18031.htm
- DOI: https://dx.doi.org/10.3748/wjg.v20.i47.18031


