Copyright
©2014 Baishideng Publishing Group Inc.
World J Gastroenterol. Dec 21, 2014; 20(47): 17877-17882
Published online Dec 21, 2014. doi: 10.3748/wjg.v20.i47.17877
Published online Dec 21, 2014. doi: 10.3748/wjg.v20.i47.17877
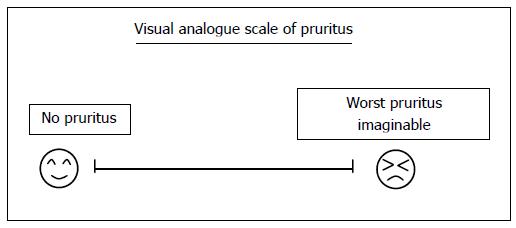
Figure 1 Visual analogue scale.
Patients marked a point on the scale corresponding to the severity of pruritus experienced in the preceding week. The scale was 10 cm in length with “worst possible pruritus” on the right-hand end of the line and “no pruritus” on the left-hand end of the line.
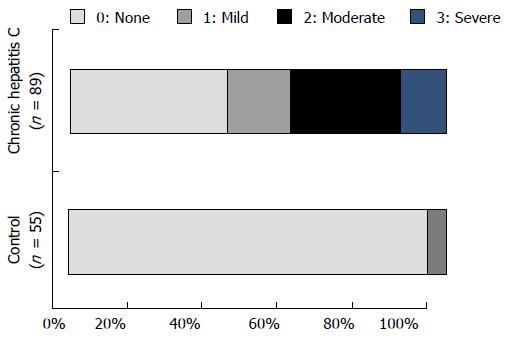
Figure 2 Pruritus scores of chronic hepatitis C and control groups.
A total of 52 of 89 patients (58.4%) in the chronic hepatitis C group had nocturnal pruritus scores ≥ 1. Only 3 of 52 patients (5.5%) in the control group had pruritus; the proportion of patients with pruritus in the control group was significantly lower than that in the chronic hepatitis C group (P < 0.0001).
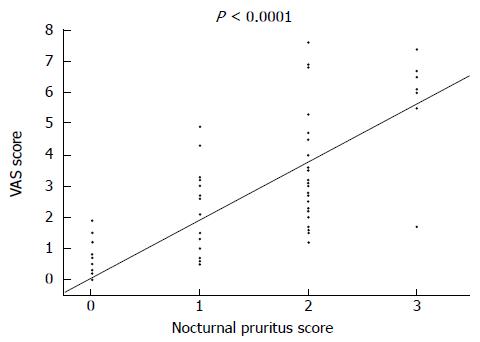
Figure 3 Relationship between nocturnal pruritus scores and visual analogue scale scores of all 144 subjects.
Nocturnal pruritus scores of 0, 1, 2, and 3 correspond to VAS scores of 0.09 ± 0.04 cm, 2.32 ± 0.54 cm, 3.50 ± 0.37 cm, and 6.23 ± 0.55 cm, respectively, with a good correlation between the pruritus score and VAS score (P < 0.0001). VAS: Visual analogue scale.
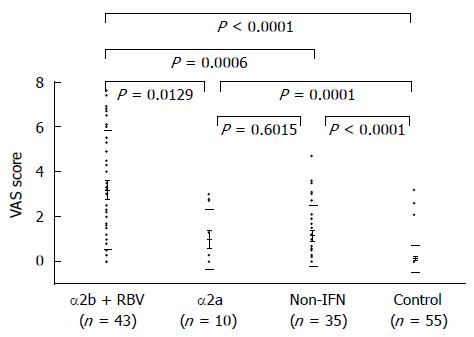
Figure 4 Visual analogue scale scores of chronic hepatitis C and control groups.
With respect to chronic hepatitis C patients, the non-IFN group, α2a group, and α2b + RBV group had VAS scores of 1.13 ± 0.29, 1.01 ± 0.56, and 3.20 ± 0.27, respectively, all of which were significantly higher than that of the control group (0.32 ± 0.26). The VAS score was significantly different between the non-IFN group and α2b + RBV group, and between the α2a group and α2b + RBV group, but the VAS score was not significantly different between the non-IFN group and α2a group. IFN: Interferon; VAS: Visual analogue scale; RBV: Ribavirin.
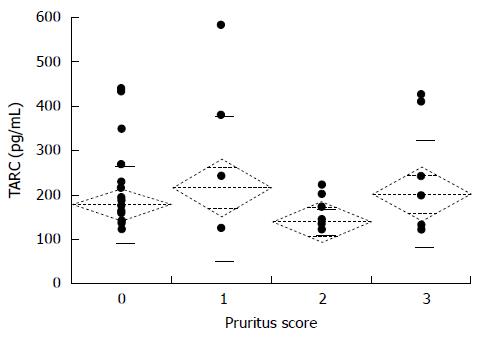
Figure 5 Association between pruritus score and serum thymus and activation-regulated chemokine level.
The mean TARC levels for the pruritus scores 0, 1, 2, and 3 were 180.0 ± 16.4 pg/mL, 217.8 ± 54.3 pg/mL, 140.8 ± 7.0 pg/mL, and 203.7 ± 38.0 pg/mL, respectively. The pruritus score did not correlate with TARC levels. TARC: Thymus and activation-regulated chemokine.
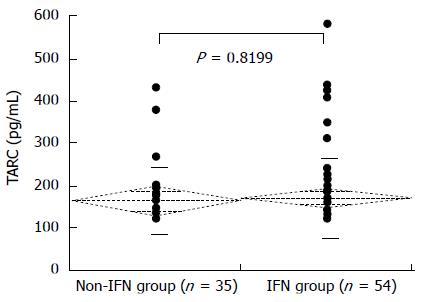
Figure 6 Interferon treatment and serum thymus and activation-regulated chemokine levels in chronic hepatitis C.
The mean serum TARC levels of the non-IFN and IFN groups were 166.8 ± 79.1 pg/ml and 173.3 ± 92.1 pg/mL, respectively; the difference in TARC levels between the two groups was not significant (P = 0.8199). TARC: Thymus and activation-regulated chemokine; IFN: Interferon.
Figure 7 Serum thymus and activation-regulated chemokine level by treatment method in chronic hepatitis C patients.
The mean serum TARC levels of the α2a and α2b + RBV groups were 165.1 ± 30.9 pg/mL and 174.7 ± 12.8 pg/mL, respectively; the difference in TARC levels between the two groups was not significant (P = 0.8011). TARC: Thymus and activation-regulated chemokine; RBV: Ribavirin.
- Citation: Suzuki K, Tamano M, Katayama Y, Kuniyoshi T, Kagawa K, Takada H, Suzuki K. Study of pruritus in chronic hepatitis C patients. World J Gastroenterol 2014; 20(47): 17877-17882
- URL: https://www.wjgnet.com/1007-9327/full/v20/i47/17877.htm
- DOI: https://dx.doi.org/10.3748/wjg.v20.i47.17877


