Copyright
©2014 Baishideng Publishing Group Inc.
World J Gastroenterol. Dec 14, 2014; 20(46): 17345-17351
Published online Dec 14, 2014. doi: 10.3748/wjg.v20.i46.17345
Published online Dec 14, 2014. doi: 10.3748/wjg.v20.i46.17345
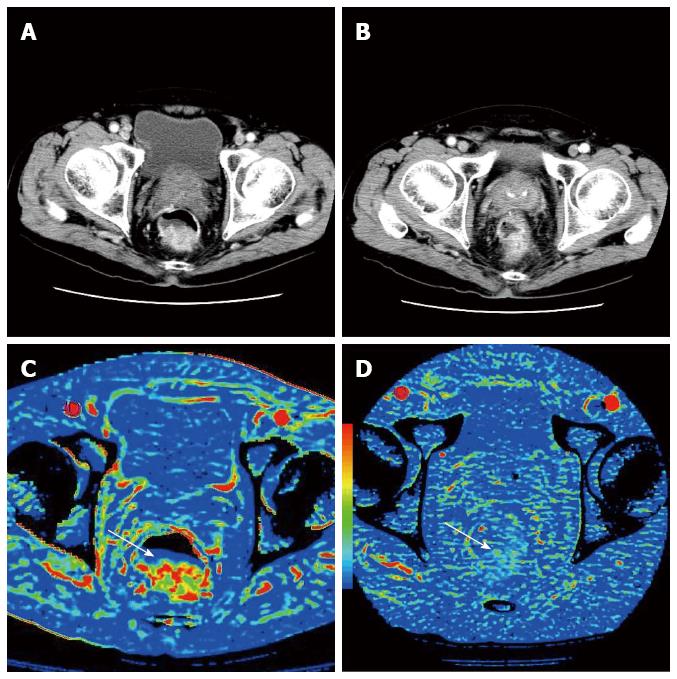
Figure 1 Perfusion change after chemoraditaion therapy.
Contrast enhanced CT images at baseline (A) and post-CRT (B). BF maps at baseline (C) and post-CRT (D). After CRT, tumor showed significant decrease in BF (arrows). CRT: Chemoraditaion therapy; CT: Computed tomography; BF: Blood flow.
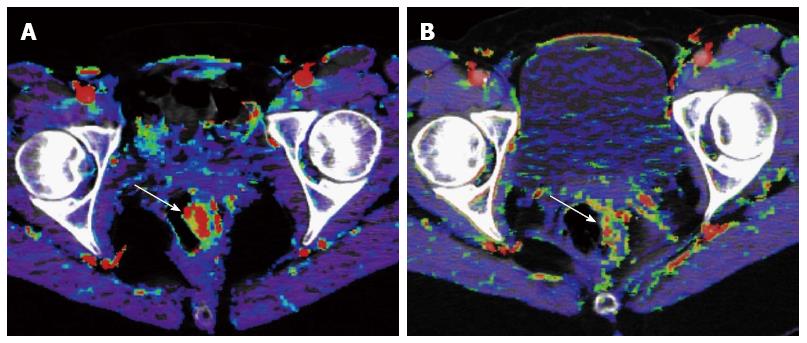
Figure 2 Perfusion change after antiangiogenic therapy.
After 2 wk of antiangiogenic therapy (bevacizumab), tumor BF decreased significantly (arrows). A: Baseline; and B: Post-therapy BF map. BF: Blood flow.
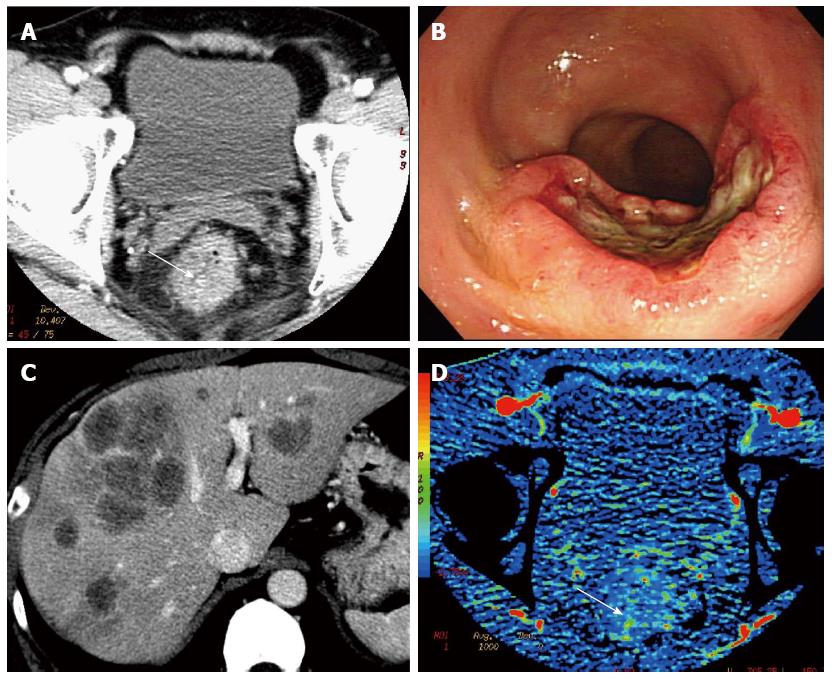
Figure 3 Tumor perfusion and distant metastases.
A-C: Rectal cancer patient with synchronous multiple liver metastases; D: Computed tomography perfusion demonstrated low tumor BF (35.3 mL/100 g per minute) (arrow). BF: Blood flow.
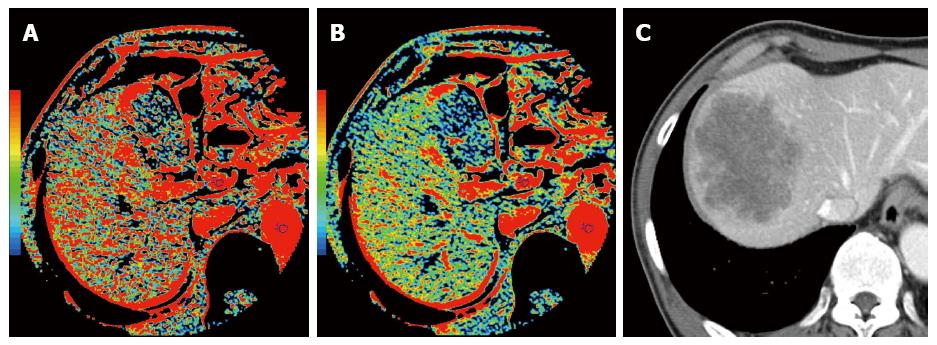
Figure 4 Hepatic perfusion and recurrence.
This patient underwent curative surgery, and was diagnosed as stage II colon cancer (no distant and lymphnode metastases). Preoperative hepatic BF (A) and hepatic arterial fraction (B) was high (BF = 191 mL/min per 100 g, HAF = 32%). After 6 mo of surgery, this patient developed a liver metastasis (C). BF: Blood flow.
- Citation: Hayano K, Fujishiro T, Sahani DV, Satoh A, Aoyagi T, Ohira G, Tochigi T, Matsubara H, Shuto K. Computed tomography perfusion imaging as a potential imaging biomarker of colorectal cancer. World J Gastroenterol 2014; 20(46): 17345-17351
- URL: https://www.wjgnet.com/1007-9327/full/v20/i46/17345.htm
- DOI: https://dx.doi.org/10.3748/wjg.v20.i46.17345


