Copyright
©2014 Baishideng Publishing Group Inc.
World J Gastroenterol. Dec 7, 2014; 20(45): 17037-17048
Published online Dec 7, 2014. doi: 10.3748/wjg.v20.i45.17037
Published online Dec 7, 2014. doi: 10.3748/wjg.v20.i45.17037
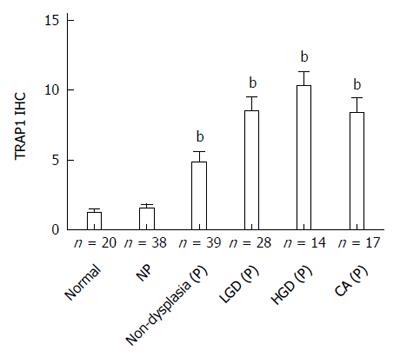
Figure 1 Tumor necrosis factor receptor-associated protein 1 staining increases with ulcerative colitis progression at both non-dysplastic and dysplastic sites.
Plot depicts the average immunohistochemistry (IHC) score ± SE for rectal samples from normal controls, non-progressors, progressors at non-dysplastic rectal sites, and progressors at dysplastic sites. The number of patient is indicated. bP < 0.01 using Mann Whitney test vs normal controls. NP: Non-progressors; P: Progressors; LGD: Low grade dysplasia; HGD: High grade dysplasia; CA: Cancer; TRAP1: Tumor necrosis factor receptor-associated protein 1.
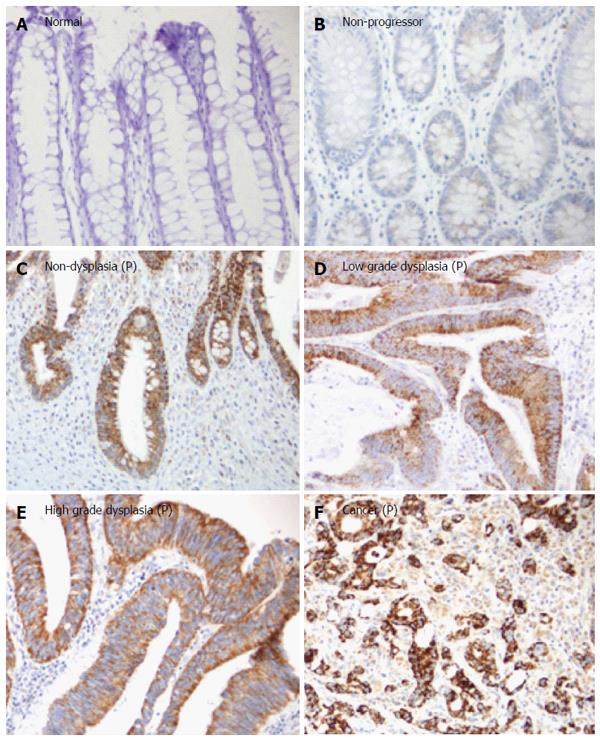
Figure 2 Representative tumor necrosis factor receptor-associated protein 1 immunohistochemistry staining in ulcerative colitis non-progressors and ulcerative colitis progressors.
A: Normal rectum from a normal control; B: Non-dysplastic rectum from a non-progressor (NP); C: Non-dysplastic rectum from a progressor (P); D: Low grade dysplasia from a progressor; E: High grade dysplasia from a progressor; F: Cancer from a progressor. All images were taken at × 20 magnification. P: Progressor.
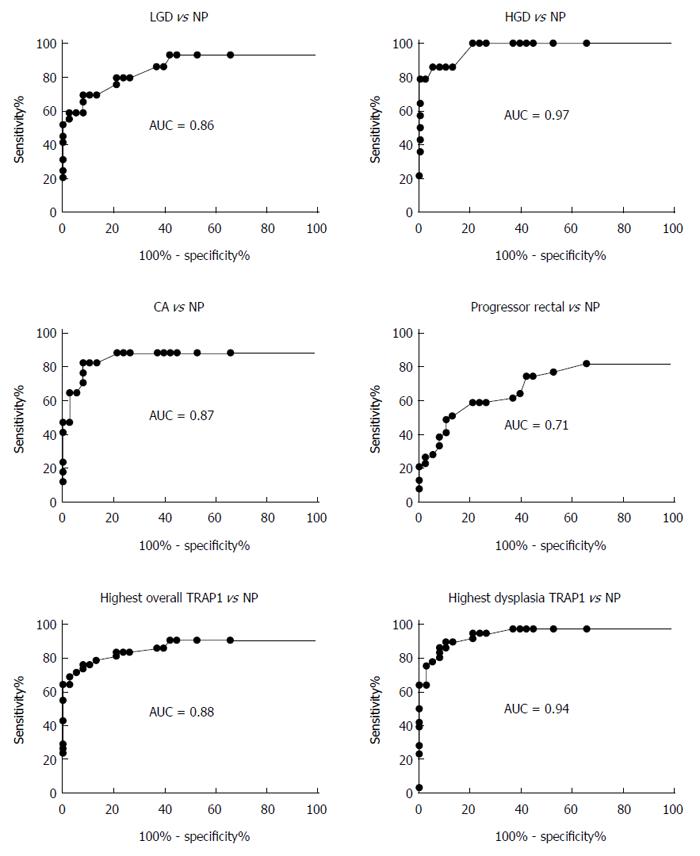
Figure 3 Evaluation of tumor necrosis factor receptor-associated protein 1 staining in different histological grades as a biomarker to distinguish progressors from non-progressors.
The different histological grades were indicated in each specific panel. The rectal tissue from progressors was non-dysplastic, and tissue from non-progressors (NP) was also non-dysplastic rectal tissue. LGD: Low grade dysplasia; HGD: High grade dysplasia; CA: Cancer; TRAP1: Tumor necrosis factor receptor-associated protein 1.
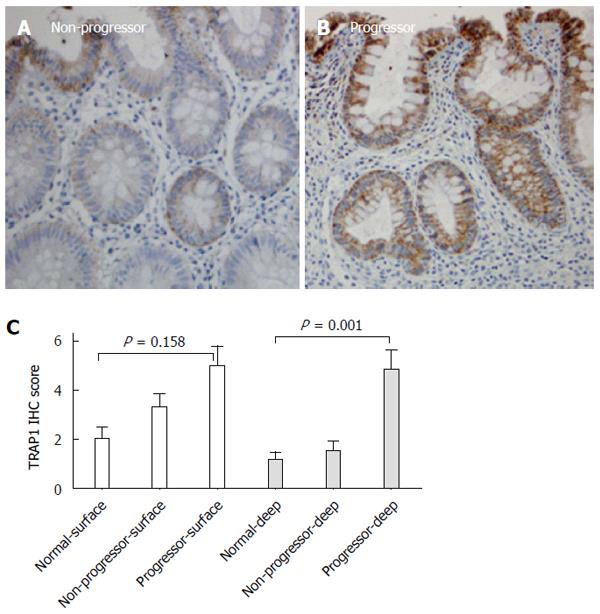
Figure 4 Surface and deep epithelium displayed different degrees of tumor necrosis factor receptor-associated protein 1 staining across all non-dysplastic colon tissues.
A: Non-dysplastic tissue from a non-progressor; B: Non-dysplastic tissue from a progressor; C: Comparison of tumor necrosis factor receptor-associated protein 1 (TRAP1) staining in the surface epithelium and deep epithelium. Only the non-dysplastic tissues from progressors were included in this comparison. P-values were determined by Kruskal-Wallis test. IHC: Immunohistochemistry.
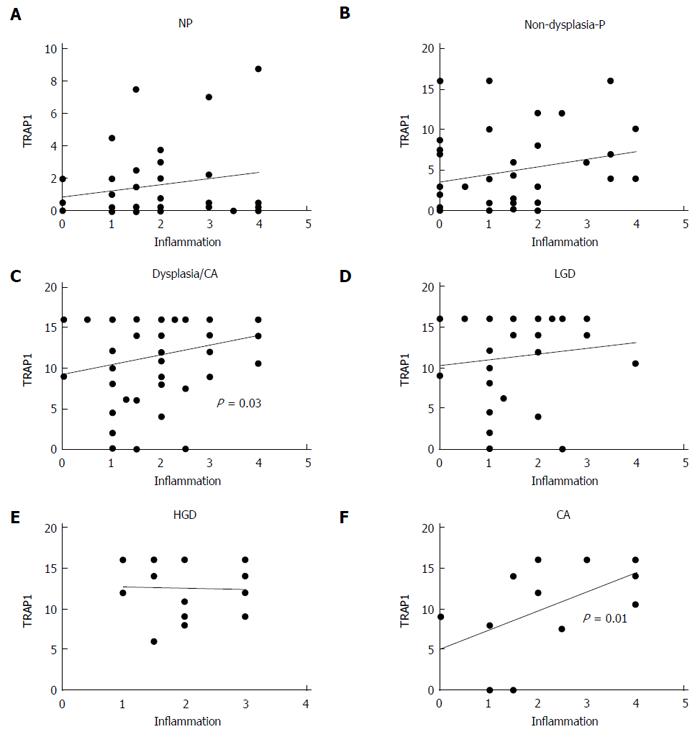
Figure 5 Correlation of tumor necrosis factor receptor-associated protein 1 expression with inflammation.
A positive correlation between tumor necrosis factor receptor-associated protein 1 (TRAP1) staining and inflammation was observed in the dysplastic tissues. A: Non-progressors (NP); B: Non-dysplastic progressors (P); C: Dysplastic/cancer (CA); D: Low grade dysplasia (LGD); E: High grade dysplasia (HGD); F: CA.
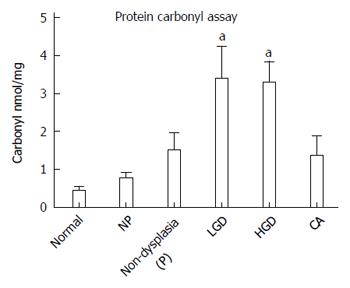
Figure 6 Detection of carbonyls in the colon mucosa of patients with ulcerative colitis.
The carbonyls were significantly increased in the colon mucosa of patients with high grade dysplasia. NP: Non-progressors; P: Progressors; CA: Cancer. aP < 0.05 vs normal group.
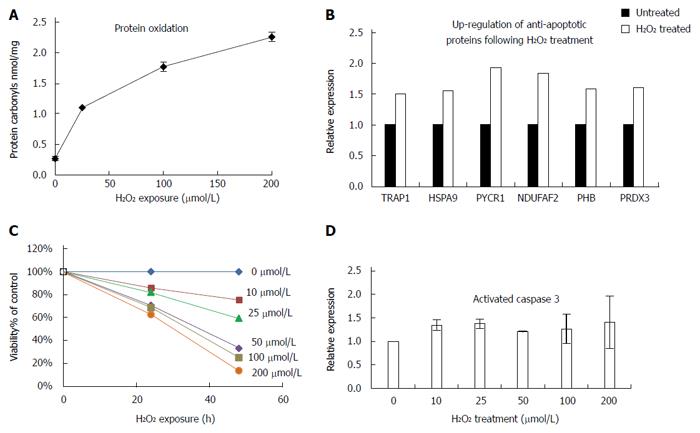
Figure 7 Tumor necrosis factor receptor-associated protein 1 expression is increased with oxidative damage in colon cancer cells.
A: HT29 cells were treated with the indicated concentrations of H2O2 for 24 h and protein carbonyls were detected using enzyme-linked immunosorbent assay; B: Up-regulation of anti-apoptotic proteins following H2O2 treatment detected by quantitative proteomics; C: Viability assay of HT29 cells following exposure to increasing amounts of H2O2; D: Detection of activated caspase 3 following 24 h H2O2 treatment.
- Citation: Chen R, Pan S, Lai K, Lai LA, Crispin DA, Bronner MP, Brentnall TA. Up-regulation of mitochondrial chaperone TRAP1 in ulcerative colitis associated colorectal cancer. World J Gastroenterol 2014; 20(45): 17037-17048
- URL: https://www.wjgnet.com/1007-9327/full/v20/i45/17037.htm
- DOI: https://dx.doi.org/10.3748/wjg.v20.i45.17037


