Copyright
©2014 Baishideng Publishing Group Inc.
World J Gastroenterol. Nov 28, 2014; 20(44): 16765-16773
Published online Nov 28, 2014. doi: 10.3748/wjg.v20.i44.16765
Published online Nov 28, 2014. doi: 10.3748/wjg.v20.i44.16765
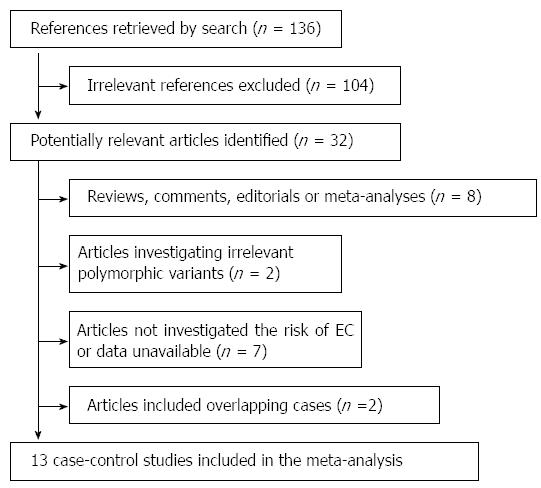
Figure 1 Flow diagram of the study selection process.
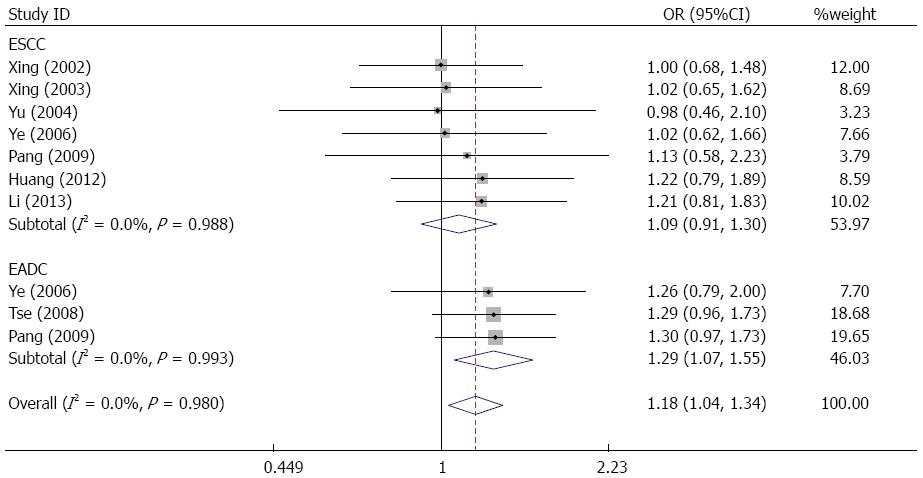
Figure 2 Forest plot for the xeroderma pigmentosum group D Asp312Asn polymorphism when stratified by cancer type in a dominant model comparison.
Dominant model: Asn/Asn + Asp/Asn vs Asp/Asp; ESCC: Esophageal squamous cell carcinoma; EADC: Esophageal adenocarcinoma.
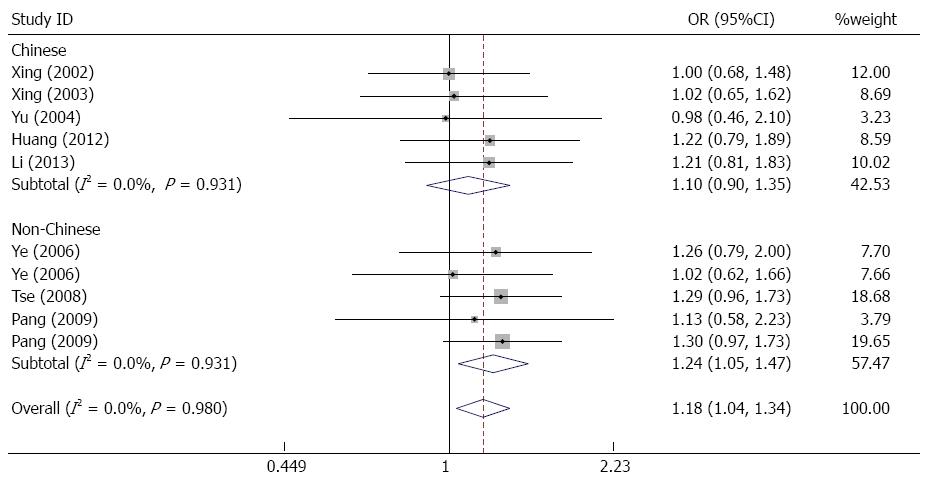
Figure 3 Forest plot for the xeroderma pigmentosum group D Asp312Asn polymorphism when stratified by ethnicity in a dominant model comparison.
Dominant model: Asn/Asn + Asp/Asn vs Asp/Asp; ESCC: Esophageal squamous cell carcinoma; EADC: Esophageal adenocarcinoma.
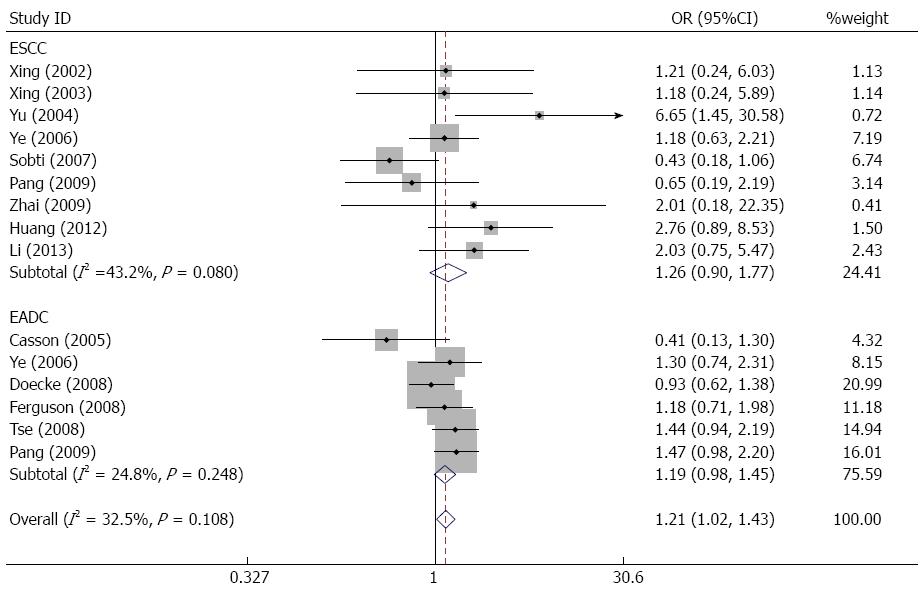
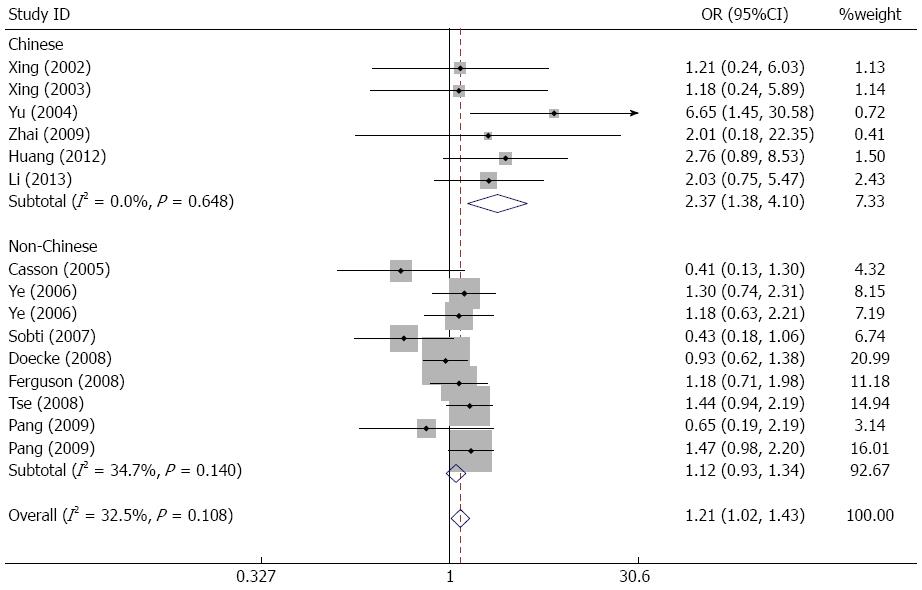
Figure 4 Forest plot for the xeroderma pigmentosum group D Lys751Gln polymorphism when stratified by cancer type in a recessive model comparison.
Recessive model: Gln/Gln vs Lys/Gln+Lys/Lys; ESCC: Esophageal squamous cell carcinoma; EADC: Esophageal adenocarcinoma.
Figure 5 Forest plot for the xeroderma pigmentosum group D Lys751Gln polymorphism when stratified by ethnicity in a recessive model comparison.
Recessive model: Gln/Gln vs Lys/Gln+Lys/Lys; ESCC: Esophageal squamous cell carcinoma; EADC: Esophageal adenocarcinoma.
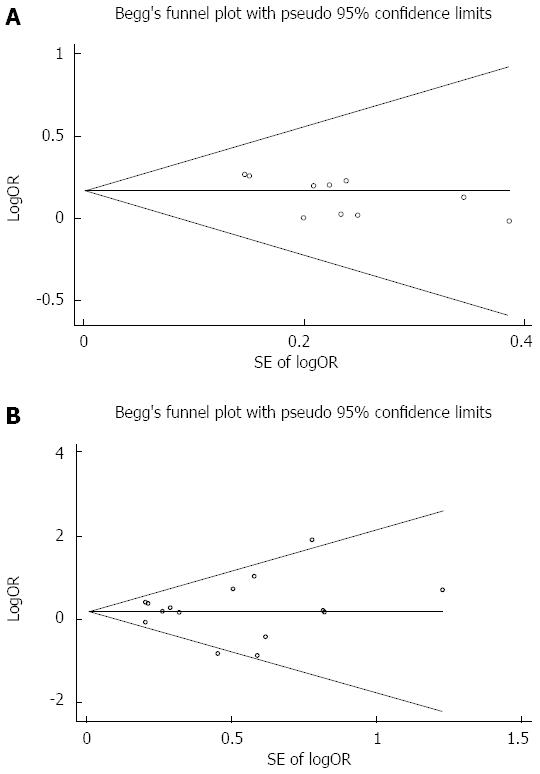
Figure 6 Funnel plots showing the associations between the xeroderma pigmentosum group D polymorphisms and esophageal cancer susceptibility.
Each point represents a separate study for the indicated association. A: Funnel plot of XPD Asp312Asn for the dominant model (Asn/Asn+Asp/Asn vs Asp/Asp); B: Funnel plot of XPD Lys751Gln for the recessive model (Gln/Gln vs Lys/Gln+Lys/Lys).
- Citation: Yang R, Zhang C, Malik A, Shen ZD, Hu J, Wu YH. Xeroderma pigmentosum group D polymorphisms and esophageal cancer susceptibility: A meta-analysis based on case-control studies. World J Gastroenterol 2014; 20(44): 16765-16773
- URL: https://www.wjgnet.com/1007-9327/full/v20/i44/16765.htm
- DOI: https://dx.doi.org/10.3748/wjg.v20.i44.16765


