Copyright
©2014 Baishideng Publishing Group Inc.
World J Gastroenterol. Nov 21, 2014; 20(43): 16275-16281
Published online Nov 21, 2014. doi: 10.3748/wjg.v20.i43.16275
Published online Nov 21, 2014. doi: 10.3748/wjg.v20.i43.16275
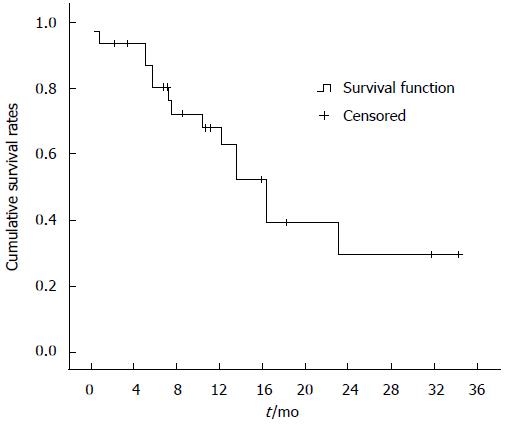
Figure 1 Overall cumulative survival Kaplan-Meier curve for the 32 study subjects.
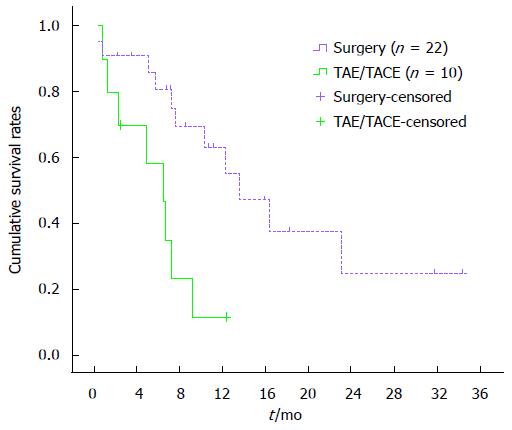
Figure 2 Comparison of cumulative survival rates between surgery group and transarterial embolization/transarterial chemoembolization group.
Cumulative survival rates in the surgery group (n = 22, median survival time of 13.61 mo; 95%CI: 7.49-19.72) and in the TAE/TACE group (n = 10, median survival time of 6.67 mo; 95%CI: 4.23-8.97). Cumulative survival rates at 4, 8 and 12 mo in the surgical group were significantly higher than in the TAE/TACE group (P < 0.01). TAE: Transarterial embolization; TACE: Transarterial chemoembolization.
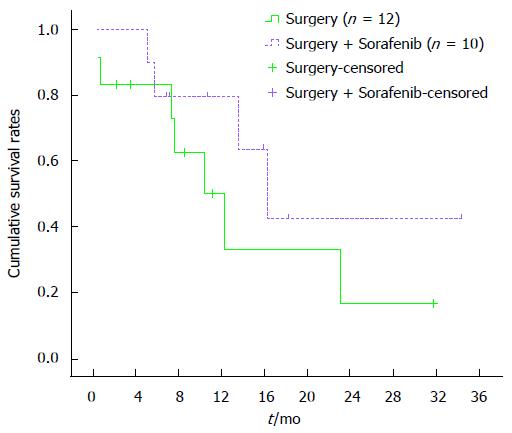
Figure 3 Comparison of cumulative survival rates between surgery alone group and surgery combined sorafenib group.
Cumulative survival rates in the surgery only group (n = 12, median survival time of 11.41 mo; 95%CI: 6.31-15.49) and in the surgery plus sorafenib group (n = 10, median survival time of 16.47 mo; 95%CI: 7.49-19.72). Cumulative survival rates at 4, 8 and 12 mo tended to be higher in the surgery plus sorafenib group, despite the difference being statistically insignificant (P = 0.18).
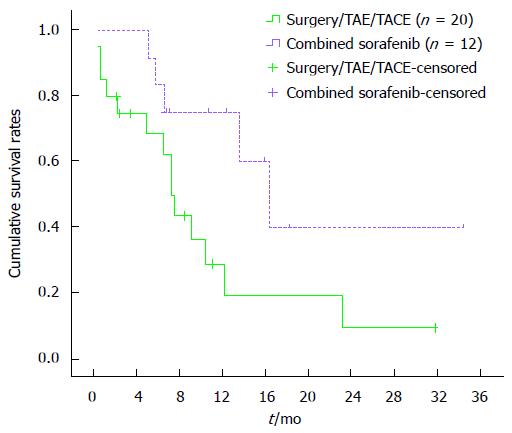
Figure 4 Comparison of cumulative survival rates between surgery alone group and transarterial embolization/transarterial chemoembolization alone group.
Cumulative survival rates in the surgery only or TAE/TACE only group (n = 20, median survival time of 8.32 mo; 95%CI: 6.93-9.57) and in the surgery or TAE/TACE plus sorafenib group (n = 12, median survival time of 16.41 mo; 95%CI: 10.97-21.83). Cumulative survival rates at 4, 8 and 12 mo were higher in the surgery or TAE/TACE plus sorafenib group (P = 0.04). TAE: Transarterial embolization; TACE: Transarterial chemoembolization.
- Citation: Zheng SZ, Liu DJ, Sun P, Yu GS, Xu YT, Gong W, Liu J. Feasibility and safety of sorafenib treatment in hepatocellular carcinoma patients with spontaneous rupture. World J Gastroenterol 2014; 20(43): 16275-16281
- URL: https://www.wjgnet.com/1007-9327/full/v20/i43/16275.htm
- DOI: https://dx.doi.org/10.3748/wjg.v20.i43.16275


