Copyright
©2014 Baishideng Publishing Group Inc.
World J Gastroenterol. Nov 14, 2014; 20(42): 15715-15726
Published online Nov 14, 2014. doi: 10.3748/wjg.v20.i42.15715
Published online Nov 14, 2014. doi: 10.3748/wjg.v20.i42.15715
Figure 1 Helicobacter pylori infection detected with the Warthin-Starry silver staining method.
Warthin-Starry silver staining revealed A: Intestinal metaplasia in the esophagus (200 × magnification); B: Helicobacter pylori (H. pylori) colonizing the esophagus (arrow) (1000 × magnification); C: H. pylori colonizing the stomach (1000 × magnification).
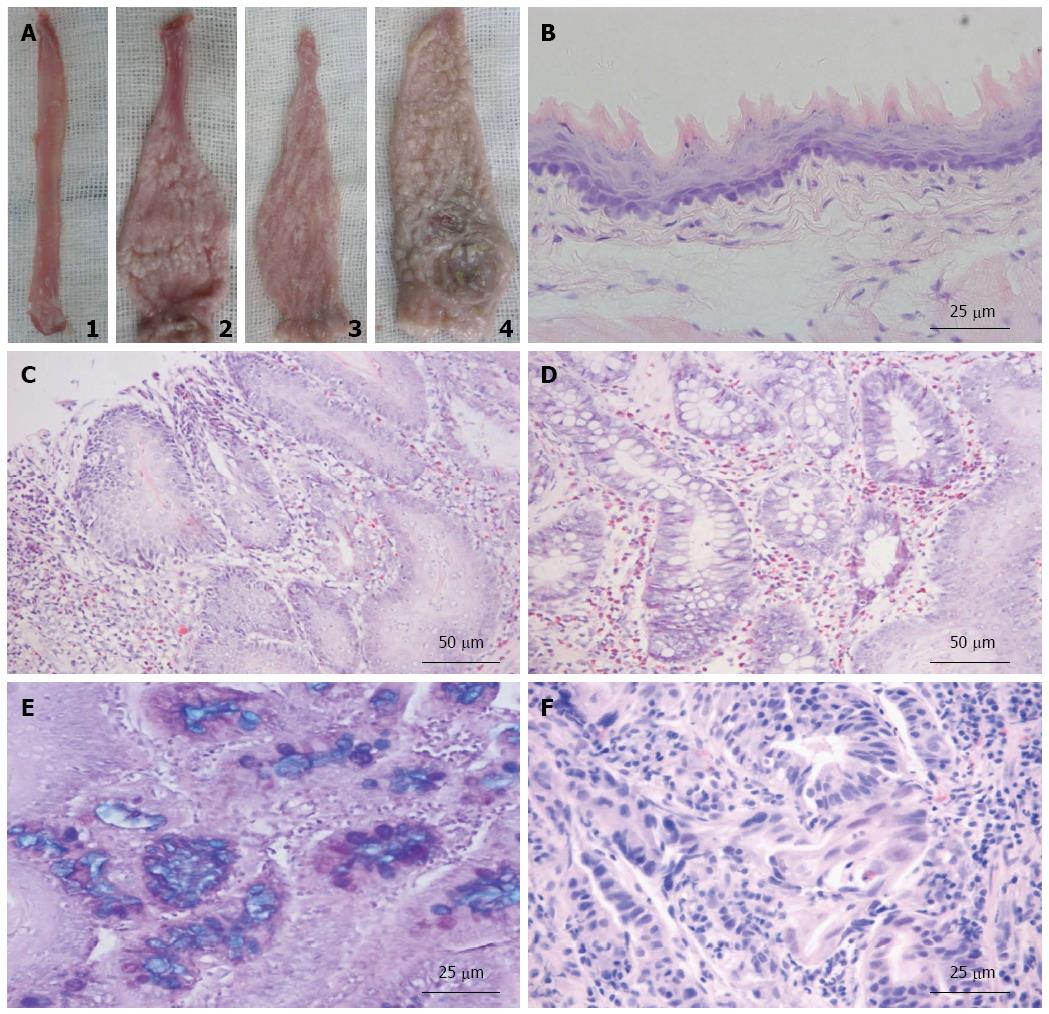
Figure 2 Macroscopic and microscopic findings in the rat esophagus.
A: Macroscopic findings in the esophagus: 1, Normal esophagus; 2, Esophagitis with tree bark appearance; 3, Barrett’s esophagus; and 4, esophageal adenocarcinoma. Microscopic findings; B: Normal squamous epithelium (400 × magnification); C: Reflux esophagitis (200 × magnification); D: Barrett’s esophagus (200 × magnification); E: Intestinal metaplasia in the esophagus detected by High-iron diamine-Alcian Blue-Periodic acid-Schiff (400 × magnification); F: Esophageal adenocarcinoma (400 × magnification).
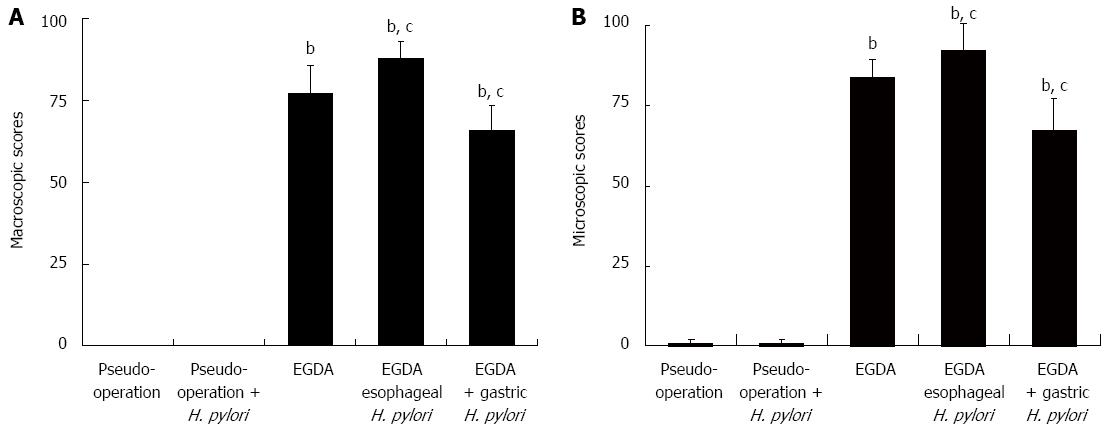
Figure 3 Findings of mucosal injury in the lower esophagus.
A: Macroscopic scoring of esophageal mucosal injury; B: Microscopic scoring of esophageal mucosal injury. bP < 0.01 vs pseudo-operation and pseudo-operation with Helicobacter pylori (H. pylori) infection groups; cP < 0.05 vs esophagogastroduodenal anastomosis (EGDA) group.
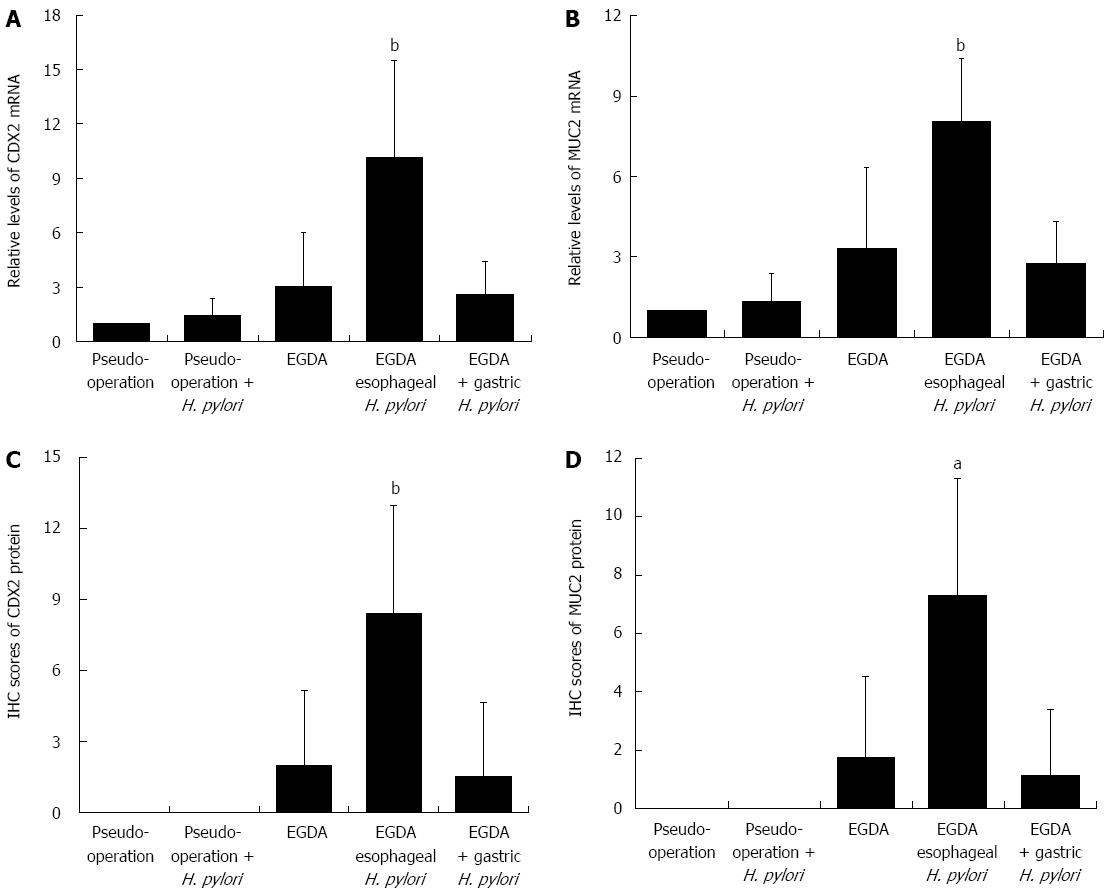
Figure 4 mRNA and protein expressions of CDX2 and MUC2 in the rat esophagus.
The relative mRNA expression levels of CDX2 (A) and MUC2 (B) in the esophagus; Immunohistochemistry (IHC) scoring of CDX2 (C) and MUC2 (D) protein expression in the esophagus. aP < 0.05, bP < 0.01 vs esophagogastroduodenal anastomosis (EGDA), pseudo-operation, and pseudo-operation with Helicobacter pylori (H. pylori) infection groups.
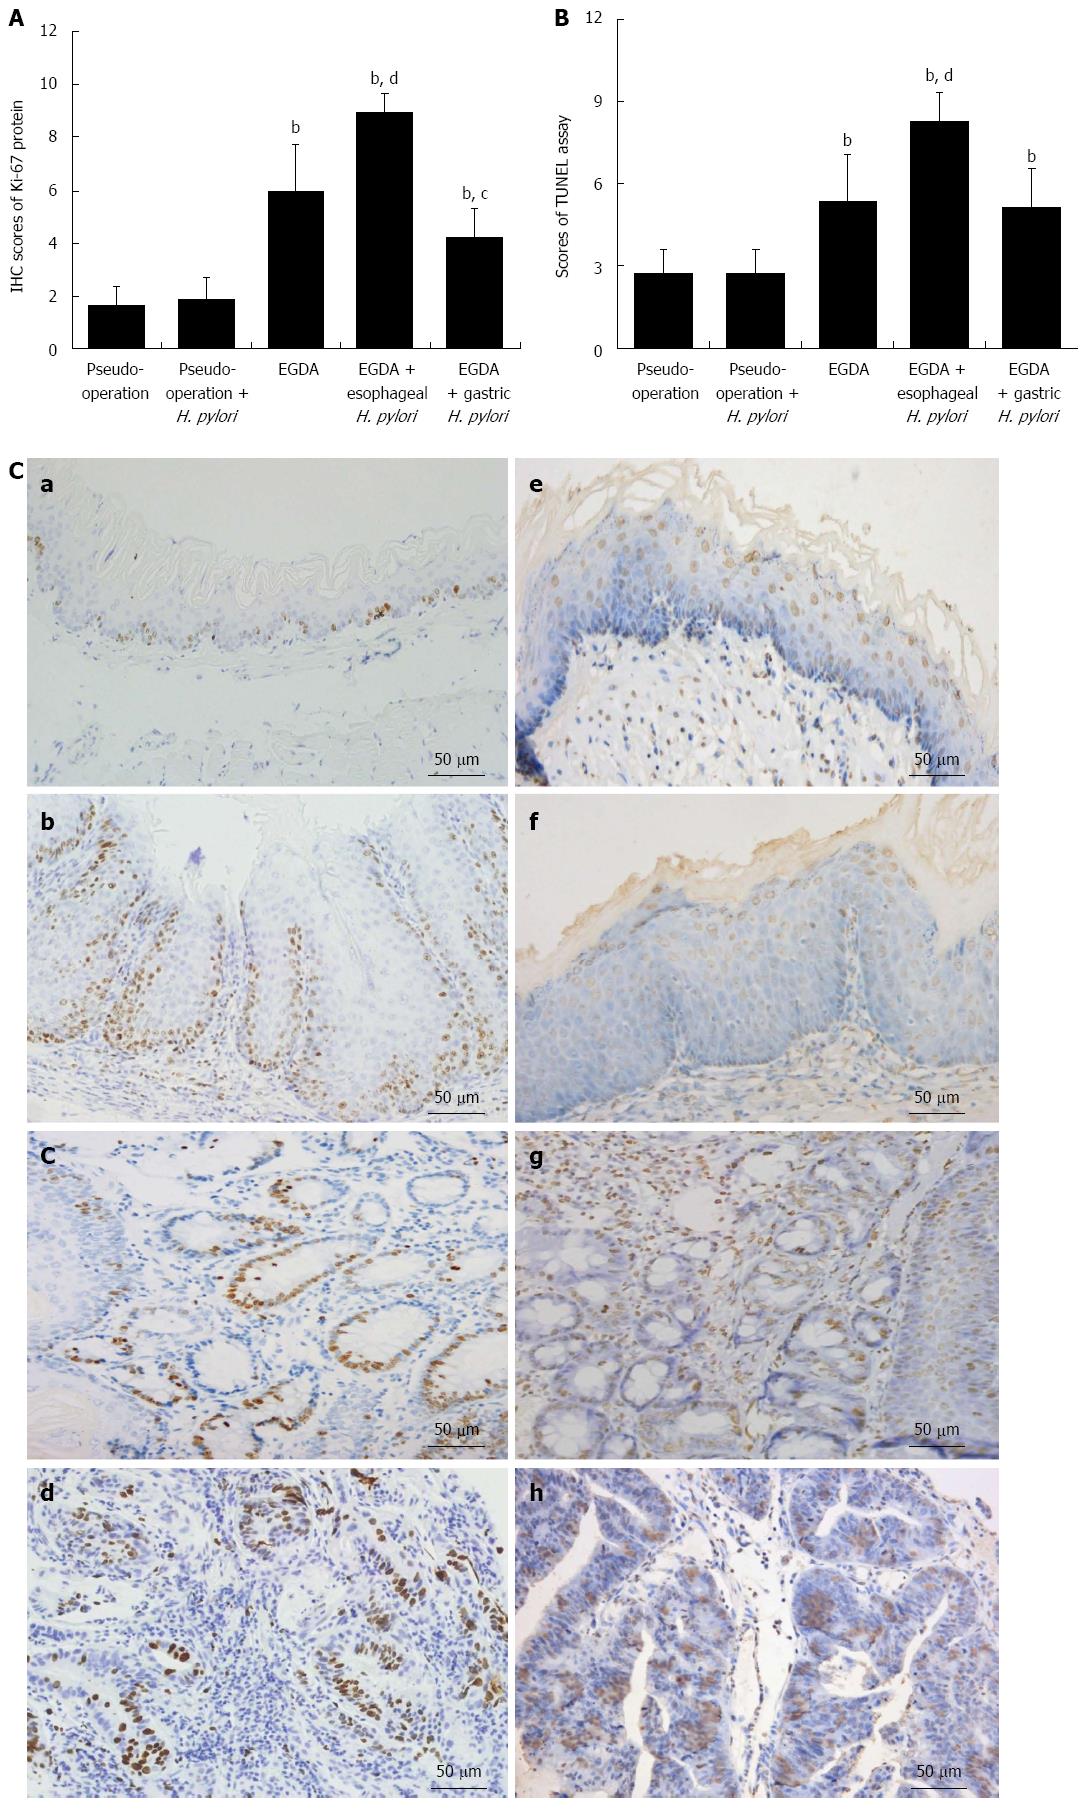
Figure 5 Ki-67 expression and TdT-mediated dUTP nick-end labeling assay in rat esophagus.
A: Immunohistochemistry (IHC) scoring of Ki-67 expression in the esophagus; B: The scoring of apoptotic cells in the esophagus as determined by TdT-mediated dUTP nick-end labeling (TUNEL) assay; C: IHC staining of Ki-67-positive cells and TUNEL-positive apoptotic cells. a, e: Normal esophagus mucosa; b, f: Esophagitis; c, g: Barrett’s esophagus; d, h: Esophageal adenocarcinoma; a-d: IHC staining of Ki-67; e-h: apoptotic cells stained by TUNEL. All of the samples were viewed under 200 × magnification. bP < 0.01 vs pseudo-operation and pseudo-operation with Helicobacter pylori (H. pylori) infection groups; cP < 0.05, dP < 0.01 vs esophagogastroduodenal anastomosis (EGDA) group.
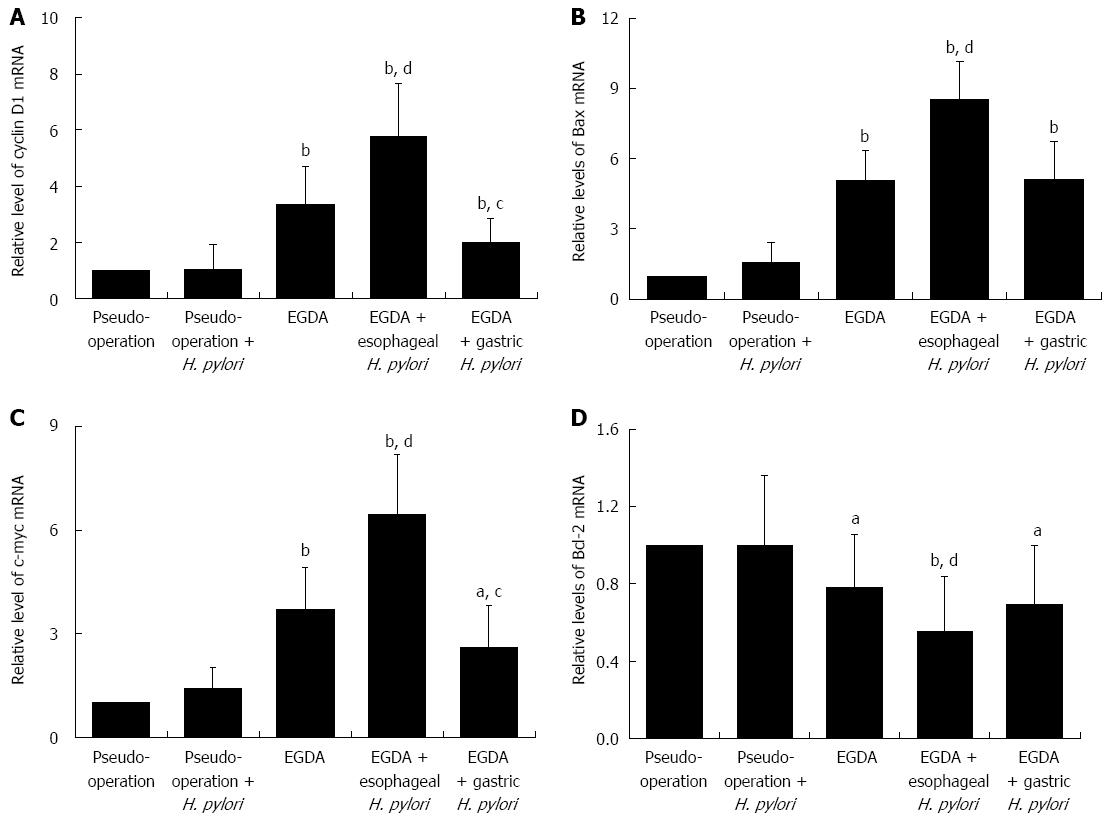
Figure 6 mRNA levels of cyclin D1, c-Myc, Bax, and Bcl-2 in the esophagus.
Quantitative real-time polymerase chain reaction determination of cyclin D1 (A), Bax (B), c-Myc (C) and Bcl-2 mRNA levels (D). aP < 0.05, bP < 0.01 vs pseudo-operation and pseudo-operation with Helicobacter pylori (H. pylori) infection groups; cP < 0.05, dP < 0.01 vs esophagogastroduodenal anastomosis (EGDA) group.
-
Citation: Chu YX, Wang WH, Dai Y, Teng GG, Wang SJ. Esophageal
Helicobacter pylori colonization aggravates esophageal injury caused by reflux. World J Gastroenterol 2014; 20(42): 15715-15726 - URL: https://www.wjgnet.com/1007-9327/full/v20/i42/15715.htm
- DOI: https://dx.doi.org/10.3748/wjg.v20.i42.15715


