Copyright
©2014 Baishideng Publishing Group Inc.
World J Gastroenterol. Nov 7, 2014; 20(41): 15440-15447
Published online Nov 7, 2014. doi: 10.3748/wjg.v20.i41.15440
Published online Nov 7, 2014. doi: 10.3748/wjg.v20.i41.15440
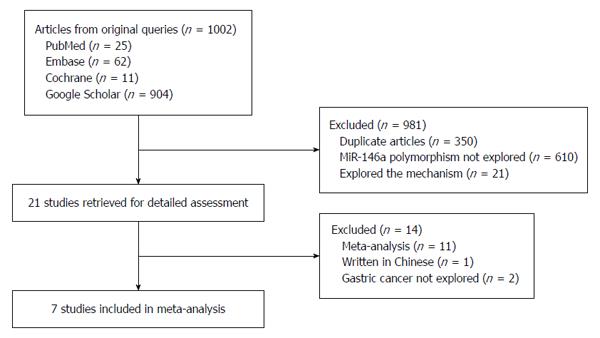
Figure 1 Flow chart of the selection of studies included in the meta-analysis.
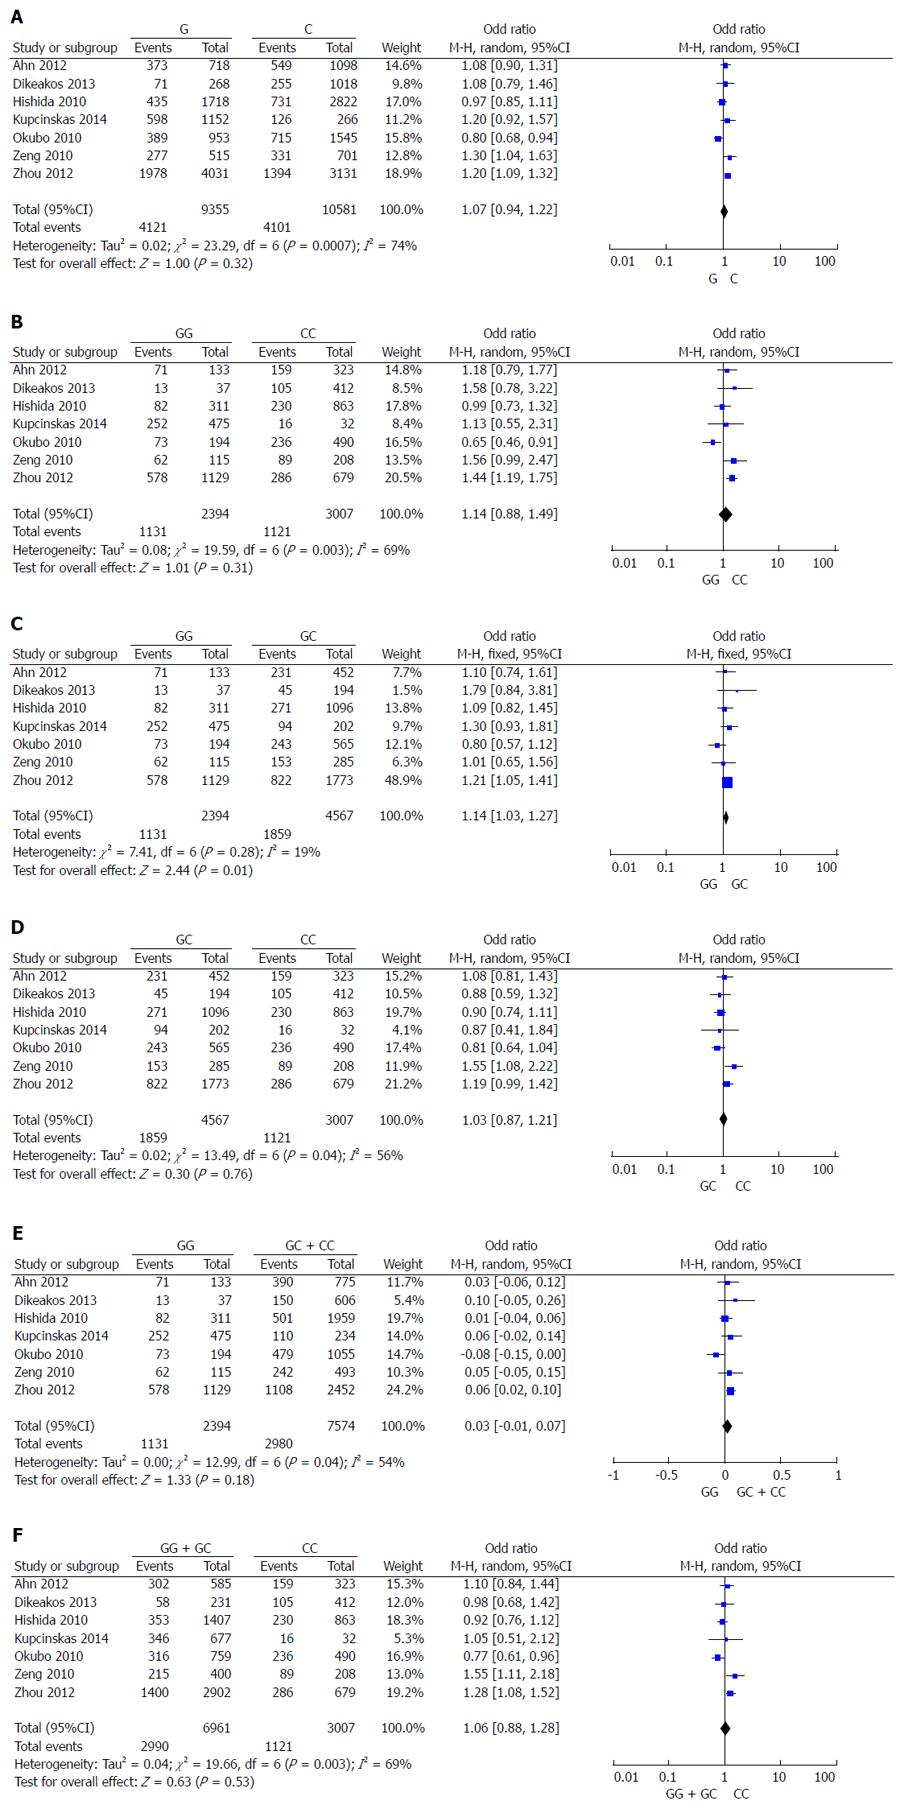
Figure 2 Forest plots of odds ratios for the association of the mir-146a G/C polymorphism with risk of gastric cancer in overall analyses.
A: G vs C; B: GG vs. CC; C: GG vs GC; D: GC vs CC; E: GG vs GC + CC; F: GG + GC vs CC.
- Citation: Xie WQ, Tan SY, Wang XF. MiR-146a rs2910164 polymorphism increases risk of gastric cancer: A meta-analysis. World J Gastroenterol 2014; 20(41): 15440-15447
- URL: https://www.wjgnet.com/1007-9327/full/v20/i41/15440.htm
- DOI: https://dx.doi.org/10.3748/wjg.v20.i41.15440


