Copyright
©2014 Baishideng Publishing Group Inc.
World J Gastroenterol. Oct 28, 2014; 20(40): 14992-14996
Published online Oct 28, 2014. doi: 10.3748/wjg.v20.i40.14992
Published online Oct 28, 2014. doi: 10.3748/wjg.v20.i40.14992
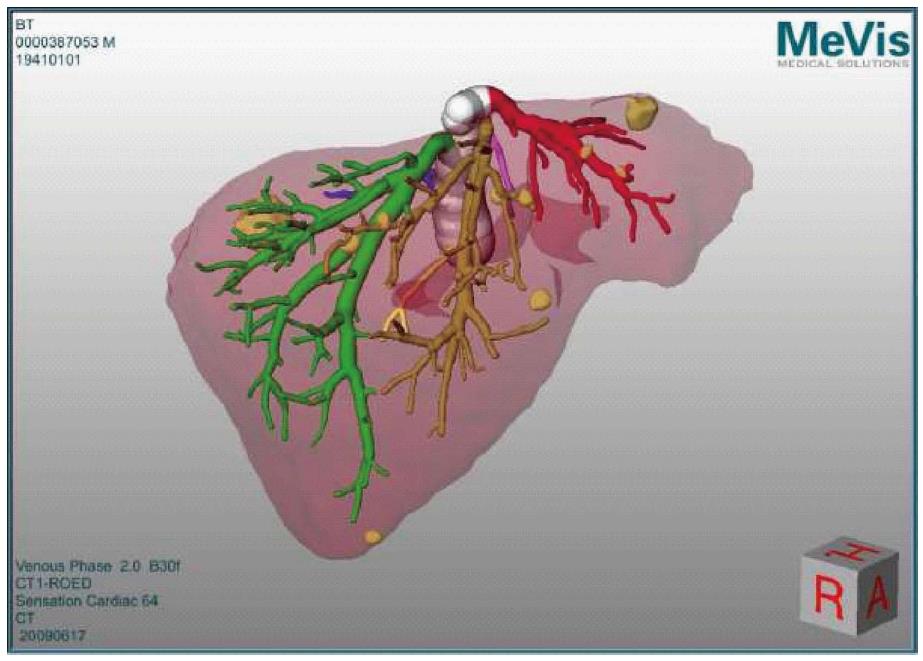
Figure 1 Planning data (as obtained from MeVis) depicting the 3D liver model as calculated from the preoperative triphasic computed tomography scan.
The image shows the hepatic veins (left hepatic vein in red, middle hepatic vein in orange-brown, right hepatic vein in green). The tumors are seen as yellow masses, distributed in both liver lobes.
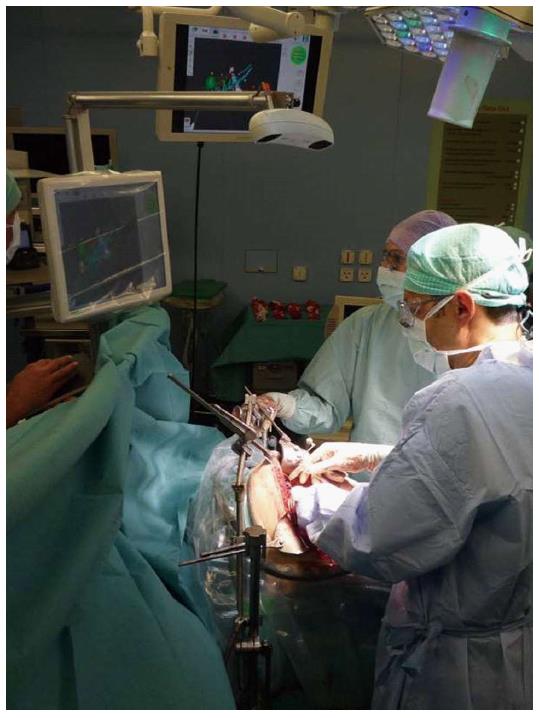
Figure 2 CAScination navigation system as it is placed at the head end of the patient with the sterile-covered touch screen facing towards the surgical team.
This allows for easy access and constant interaction with the 3D planning model displayed on the screen.
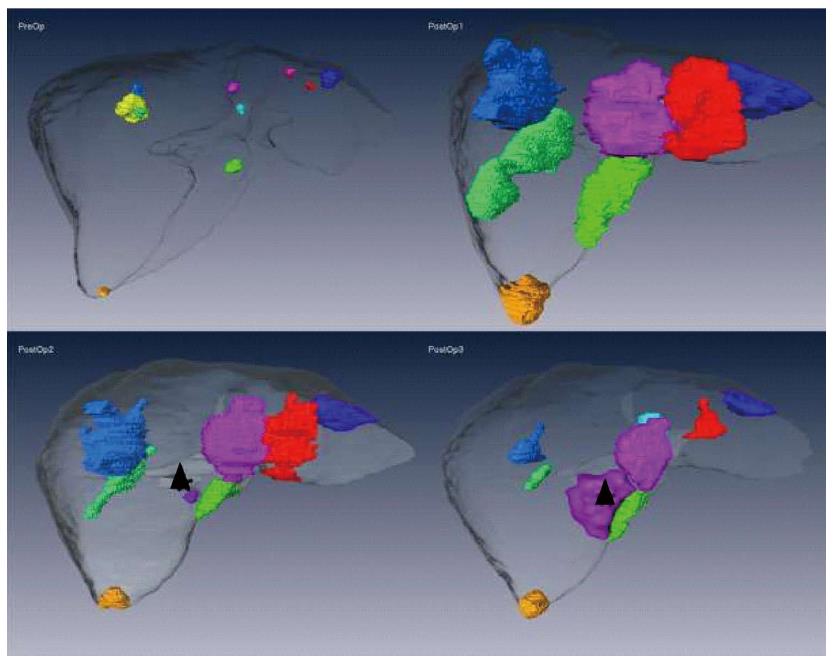
Figure 3 MeVis computed tomography data.
Four MeVis computed tomography data sets taken preoperatively (upper left panel) and at three further separate postoperative time points (3 mo, upper right panel, 9 mo, lower left panel, and 12 mo, lower right panel). While the upper left panel shows the actual size of the ten liver lesions prior to surgery/ablation, color-coded to facilitate individual tumor follow-up, subsequent panels show the evolution of the ablation volumes with time. The magenta-colored new lesion, seen in the final two follow-up computed tomography scans, is depicted with arrowheads.
- Citation: Banz VM, Baechtold M, Weber S, Peterhans M, Inderbitzin D, Candinas D. Computer planned, image-guided combined resection and ablation for bilobar colorectal liver metastases. World J Gastroenterol 2014; 20(40): 14992-14996
- URL: https://www.wjgnet.com/1007-9327/full/v20/i40/14992.htm
- DOI: https://dx.doi.org/10.3748/wjg.v20.i40.14992


