Copyright
©2014 Baishideng Publishing Group Inc.
World J Gastroenterol. Oct 28, 2014; 20(40): 14992-14996
Published online Oct 28, 2014. doi: 10.3748/wjg.v20.i40.14992
Published online Oct 28, 2014. doi: 10.3748/wjg.v20.i40.14992
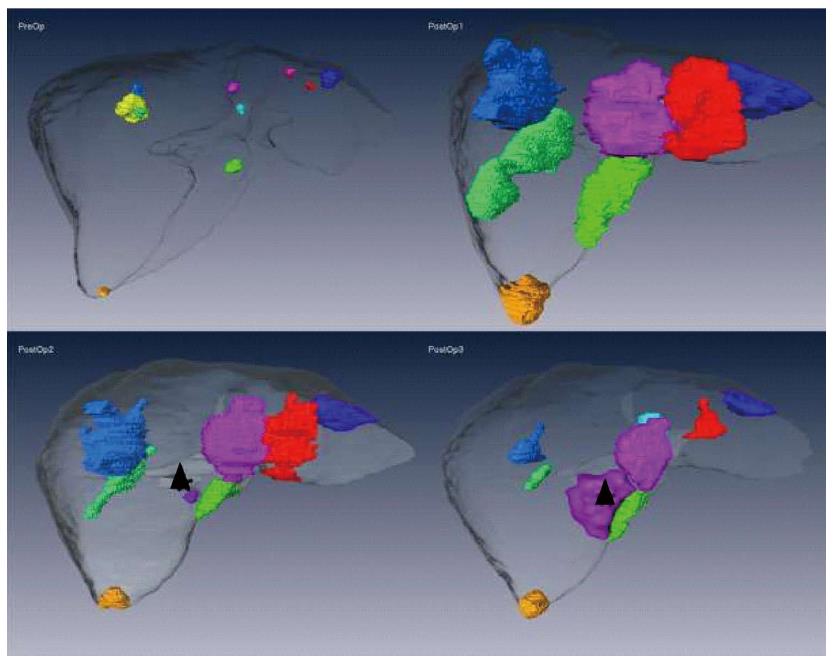
Figure 3 MeVis computed tomography data.
Four MeVis computed tomography data sets taken preoperatively (upper left panel) and at three further separate postoperative time points (3 mo, upper right panel, 9 mo, lower left panel, and 12 mo, lower right panel). While the upper left panel shows the actual size of the ten liver lesions prior to surgery/ablation, color-coded to facilitate individual tumor follow-up, subsequent panels show the evolution of the ablation volumes with time. The magenta-colored new lesion, seen in the final two follow-up computed tomography scans, is depicted with arrowheads.
- Citation: Banz VM, Baechtold M, Weber S, Peterhans M, Inderbitzin D, Candinas D. Computer planned, image-guided combined resection and ablation for bilobar colorectal liver metastases. World J Gastroenterol 2014; 20(40): 14992-14996
- URL: https://www.wjgnet.com/1007-9327/full/v20/i40/14992.htm
- DOI: https://dx.doi.org/10.3748/wjg.v20.i40.14992


