Copyright
©2014 Baishideng Publishing Group Inc.
World J Gastroenterol. Oct 28, 2014; 20(40): 14950-14957
Published online Oct 28, 2014. doi: 10.3748/wjg.v20.i40.14950
Published online Oct 28, 2014. doi: 10.3748/wjg.v20.i40.14950
Figure 1 Changes in hepatic histology.
A: Normal control group; B: Type 2 diabetes mellitus/nonalcoholic fatty liver disease group; C: Globular adiponectin-treated group (hematoxylin-eosin staining, × 200).
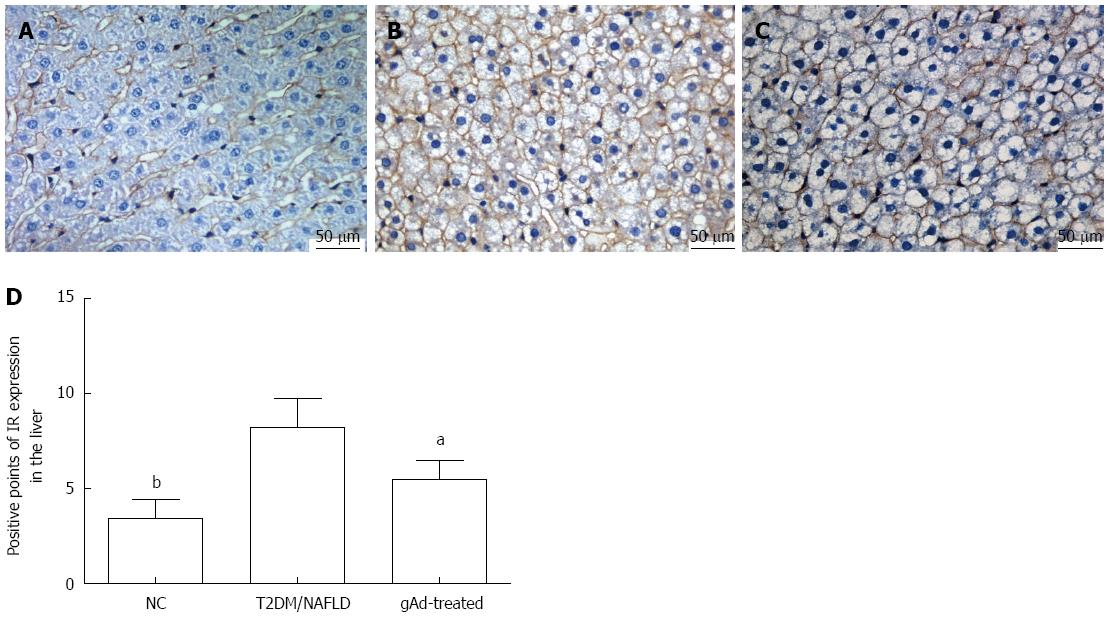
Figure 2 Immunohistochemical staining for insulin receptor in liver tissues.
A: Normal control (NC) group; B: Type 2 diabetes mellitus/nonalcoholic fatty liver disease (T2DM/NAFLD) group; C: Globular adiponectin (gAd)-treated group (× 400); D: Bar graph represents the relative expression levels of insulin receptor (IR) in the NC, T2DM/NAFLD and gAd-treated groups based on the intensity and extent of staining. The values are depicted as mean ± SD (n = 7). T2DM/NAFLD vs gAd-treated, aP < 0.05, bP < 0.01 vs T2DM/NAFLD.
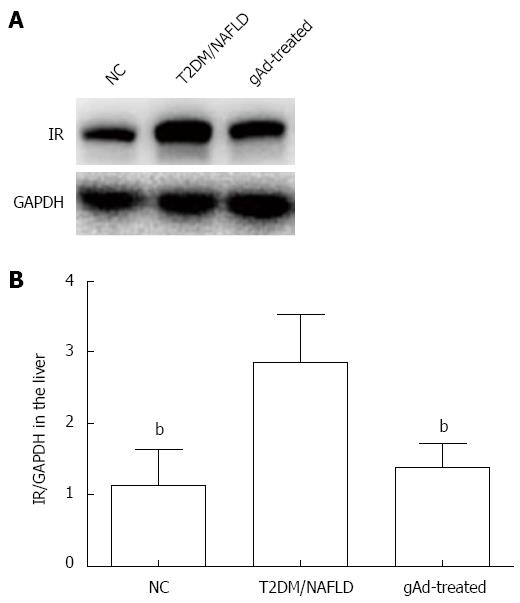
Figure 3 Insulin receptor protein expression in rat liver tissues of each group.
A: Insulin receptor (IR) expression was assessed by Western blot analysis; B: The results are shown as the ratio of IR to glyceraldehyde-3-phosphate dehydrogenase (GAPDH) based on densitometry analysis. The values are expressed as mean ± SD (n = 7). bP < 0.01 vs T2DM/NAFLD. NC: Normal control; T2DM: Type 2 diabetes mellitus; NAFLD: Nonalcoholic fatty liver disease; gAd: Globular adiponectin.
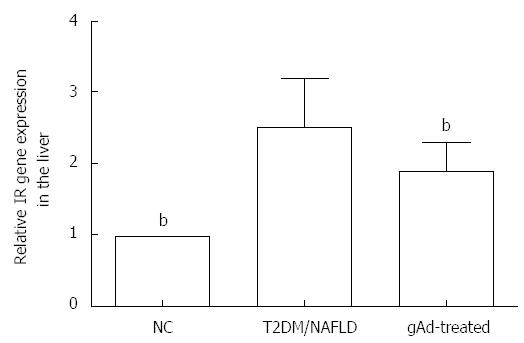
Figure 4 Insulin receptor mRNA expression in rat liver tissues of each group.
Insulin receptor (IR) mRNA expression was assessed by RT-PCR analysis. The results are shown as a ratio of IR to β-actin based on densitometry analysis. The values are expressed as mean ± SD (n = 7). bP < 0.01 vs T2DM/NAFLD. NC: Normal control; T2DM: Type 2 diabetes mellitus; NAFLD: Nonalcoholic fatty liver disease; gAd: Globular adiponectin.
- Citation: Ma H, Cui F, Dong JJ, You GP, Yang XJ, Lu HD, Huang YL. Therapeutic effects of globular adiponectin in diabetic rats with nonalcoholic fatty liver disease. World J Gastroenterol 2014; 20(40): 14950-14957
- URL: https://www.wjgnet.com/1007-9327/full/v20/i40/14950.htm
- DOI: https://dx.doi.org/10.3748/wjg.v20.i40.14950


