Copyright
©2014 Baishideng Publishing Group Co.
World J Gastroenterol. Jan 28, 2014; 20(4): 1067-1073
Published online Jan 28, 2014. doi: 10.3748/wjg.v20.i4.1067
Published online Jan 28, 2014. doi: 10.3748/wjg.v20.i4.1067
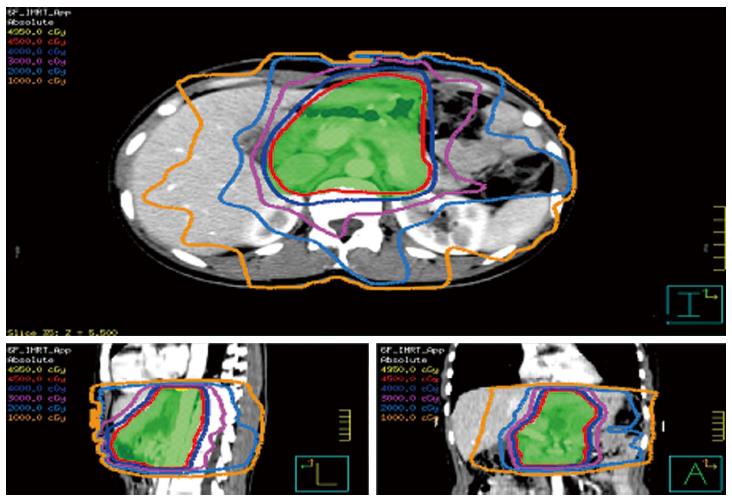
Figure 1 Distribution of 6-field intensity modulated radiotherapy plan.
Isodose distributions are shown in three orthogonal planes through the middle of the planning target volume (PTV). The isodose levels are shown colored lines over the computed tomography images, with the green area indicating the PTV.
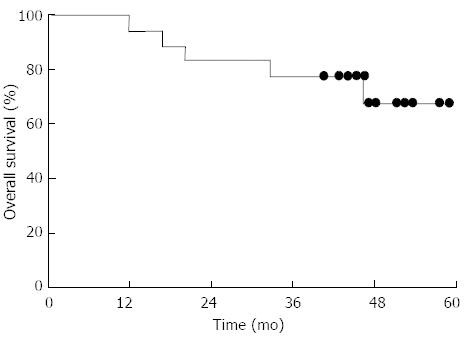
Figure 2 Overall survival rates, according to the Kaplan-Meier technique.
- Citation: Wang X, Jin J, Li YX, Ren H, Fang H, Wang SL, Liu YP, Wang WH, Yu ZH, Song YW, Liu XF. Phase I study of postoperative radiotherapy combined with capecitabine for gastric cancer. World J Gastroenterol 2014; 20(4): 1067-1073
- URL: https://www.wjgnet.com/1007-9327/full/v20/i4/1067.htm
- DOI: https://dx.doi.org/10.3748/wjg.v20.i4.1067


