Copyright
©2014 Baishideng Publishing Group Co.
World J Gastroenterol. Jan 28, 2014; 20(4): 1021-1029
Published online Jan 28, 2014. doi: 10.3748/wjg.v20.i4.1021
Published online Jan 28, 2014. doi: 10.3748/wjg.v20.i4.1021
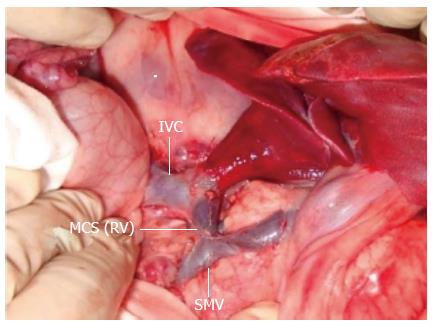
Figure 1 Photograph of the vascular anastomosis with the renal vein.
IVC: Inferior vena cava; RV: Renal vein; MCS: Mesocaval shunt; SMV: Superior mesenteric vein.
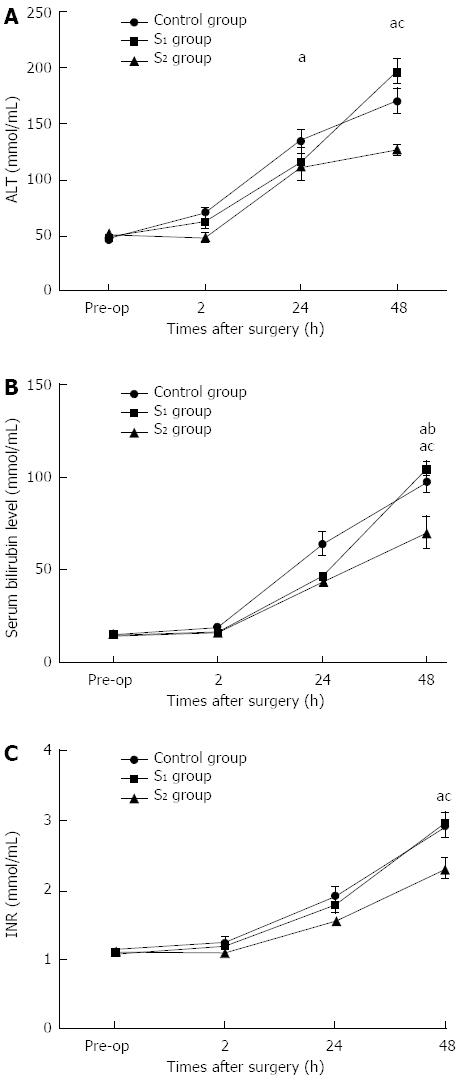
Figure 2 Changes in serum alanine aminotransferase, total bilirubin and international normalized ratio values.
A: Alanine aminotransferase (ALT); B: Total bilirubin; C: International normalized ratio (INR). aP < 0.05 for comparison between S1 and control groups; cP < 0.05 for comparison between S2 and S1 groups.
Figure 3 Sinusoidal endothelial injury following hepatectomy.
A and B: Hematoxylin and eosin staining; C and D: Transmission electron microscopy of tissue samples taken 1 h after hepatectomy (× 400 magnification). Structure of the endothelial lining was preserved (arrow); Sinusoidal endothelial lining destroyed (arrow head).
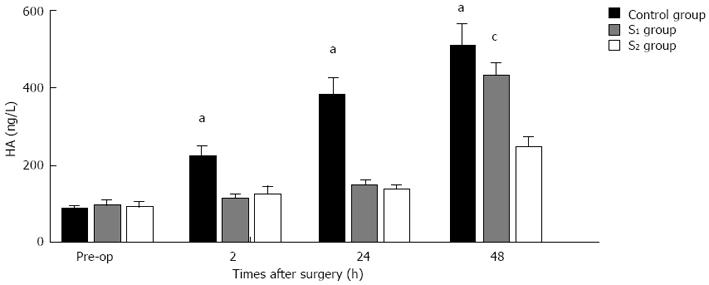
Figure 4 Serial changes in hyaluronic acid levels in the three groups.
aP < 0.05 for comparison between S1 and control groups; cP < 0.05 for comparison between S2 and S1 groups. HA: Hyaluronic acid.
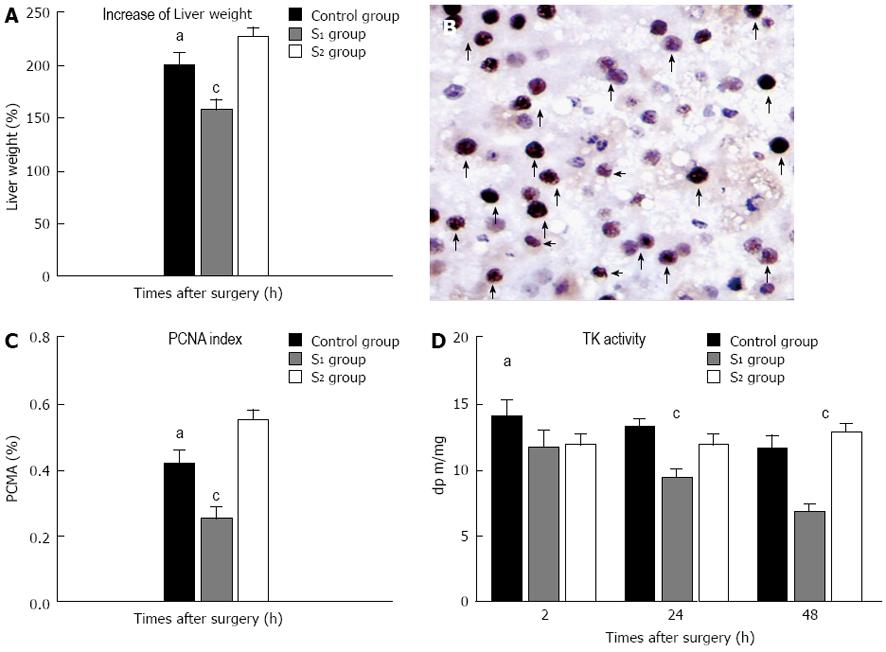
Figure 5 Liver regeneration and apoptosis.
A: Percentage increase in liver remnant weights; B: Proliferating cell nuclear antigen (PCNA) staining of liver remnant (positive cells are indicated by arrows; × 400 magnification); C: Microphotometric evaluation of PCNA index in PCNA-stained tissue 48 h partial hepatectomy. Values are expressed as mean ± SD; n = 6 in both groups. D: Thymidine kinase (TK) activity. aP < 0.05 for comparison between S1 and control groups; cP < 0.05 for comparison between S2 and S1 groups. PI was used to quantify hepatic regeneration. PCNA data were expressed as the percentage of PCNA-stained hepatocytes per total number of hepatocytes.
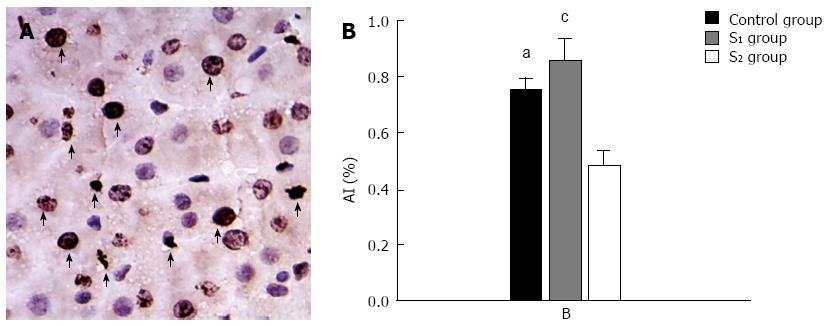
Figure 6 Terminal deoxynucleotidyl transferase-mediated dUTP-biotin nick end labeling staining and AI.
A: Terminal deoxynucleotidyl transferase-mediated dUTP-biotin nick end labeling (TUNEL) assay results at 48 h partial hepatectomy (× 400 magnification). Many TUNEL-positive cells (arrows) were present in the liver remnant; B: Microphotometric evaluation of apoptosis index (AI) in TUNEL-stained tissue at 48 h after hepatectomy. Values are expressed as mean ± SD. aP < 0.05 for comparison between S1 and control groups; cP < 0.05 for comparison between S2 and S1 groups. Percentage of TUNEL-positive cells relative to the total cell count was used to estimate AI.
Figure 7 Serial changes in serum lipopolysaccharide levels (A) and blood bacterial DNA levels (B).
aP < 0.05 for comparison between S1 and control groups; cP < 0.05 for comparison between S2 and S1 groups. LPS: Lipopolysaccharide.
- Citation: Wang XQ, Xu YF, Tan JW, Lv WP, Liu Z, Zeng JP, Dong JH. Portal inflow preservation during portal diversion in small-for-size syndrome. World J Gastroenterol 2014; 20(4): 1021-1029
- URL: https://www.wjgnet.com/1007-9327/full/v20/i4/1021.htm
- DOI: https://dx.doi.org/10.3748/wjg.v20.i4.1021


