Copyright
©2014 Baishideng Publishing Group Inc.
World J Gastroenterol. Oct 21, 2014; 20(39): 14495-14499
Published online Oct 21, 2014. doi: 10.3748/wjg.v20.i39.14495
Published online Oct 21, 2014. doi: 10.3748/wjg.v20.i39.14495
Figure 1 Magnetic resonance imaging - abdomen from two months prior to embolization.
Massive splenomegaly is shown (A, asterisk) with associated cavernous transformation of the portal vein (B, arrow head) and large splenorenal varices (C, arrow).
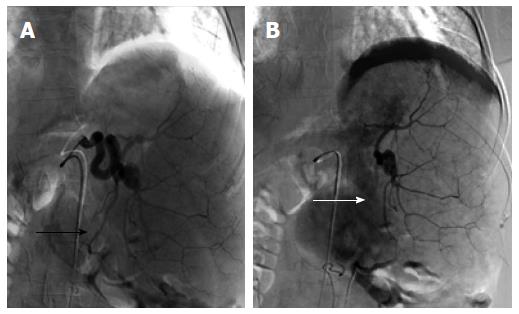
Figure 2 Splenic artery embolization with a single, inferomedial branch targeted to achieve 30%-40% of splenic parenchymal embolization.
The pre-embolization blood supply to this vascular territory (A, black arrow) is significantly reduced following the embolization (B, white arrow), with reactive hyperemia of the medial aspect of the spleen.
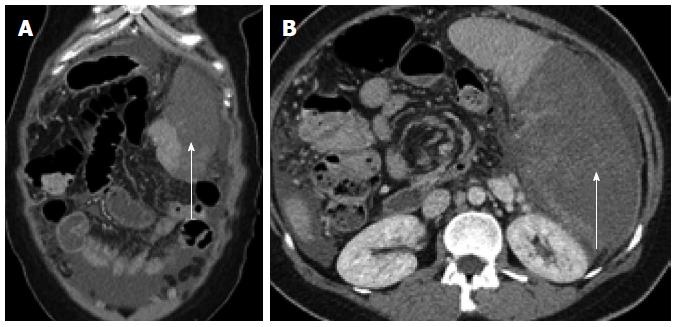
Figure 3 Five days following embolization the patient presented with symptoms of post-embolization syndrome and extensive splenic infarction, markedly exceeding that expected by the targeted vascular territory.
Arrows demonstrate significant volume of non-enhancing spleen in both coronal (A) and axial (B) images
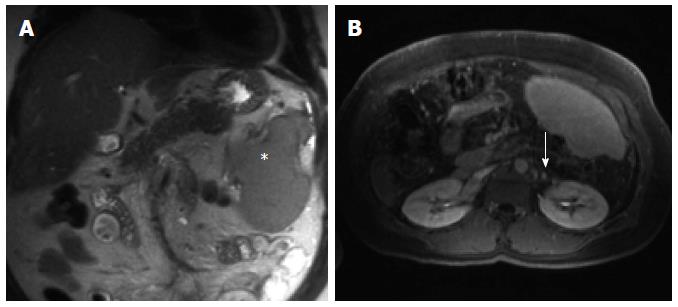
Figure 4 Abdominal magnetic resonance imaging 3 years post partial splenic embolization shows a significantly reduced splenic volume (A, asterisk) with partial recuperation of the previously embolized parenchyma (B) and near complete resolution of the peri-renal varices, confirming reduced variceal and portal venous pressures (B, arrow).
- Citation: Gianotti R, Charles H, Hymes K, Chandarana H, Sigal S. Treatment of gastric varices with partial splenic embolization in a patient with portal vein thrombosis and a myeloproliferative disorder. World J Gastroenterol 2014; 20(39): 14495-14499
- URL: https://www.wjgnet.com/1007-9327/full/v20/i39/14495.htm
- DOI: https://dx.doi.org/10.3748/wjg.v20.i39.14495


