Copyright
©2014 Baishideng Publishing Group Inc.
World J Gastroenterol. Oct 21, 2014; 20(39): 14430-14441
Published online Oct 21, 2014. doi: 10.3748/wjg.v20.i39.14430
Published online Oct 21, 2014. doi: 10.3748/wjg.v20.i39.14430
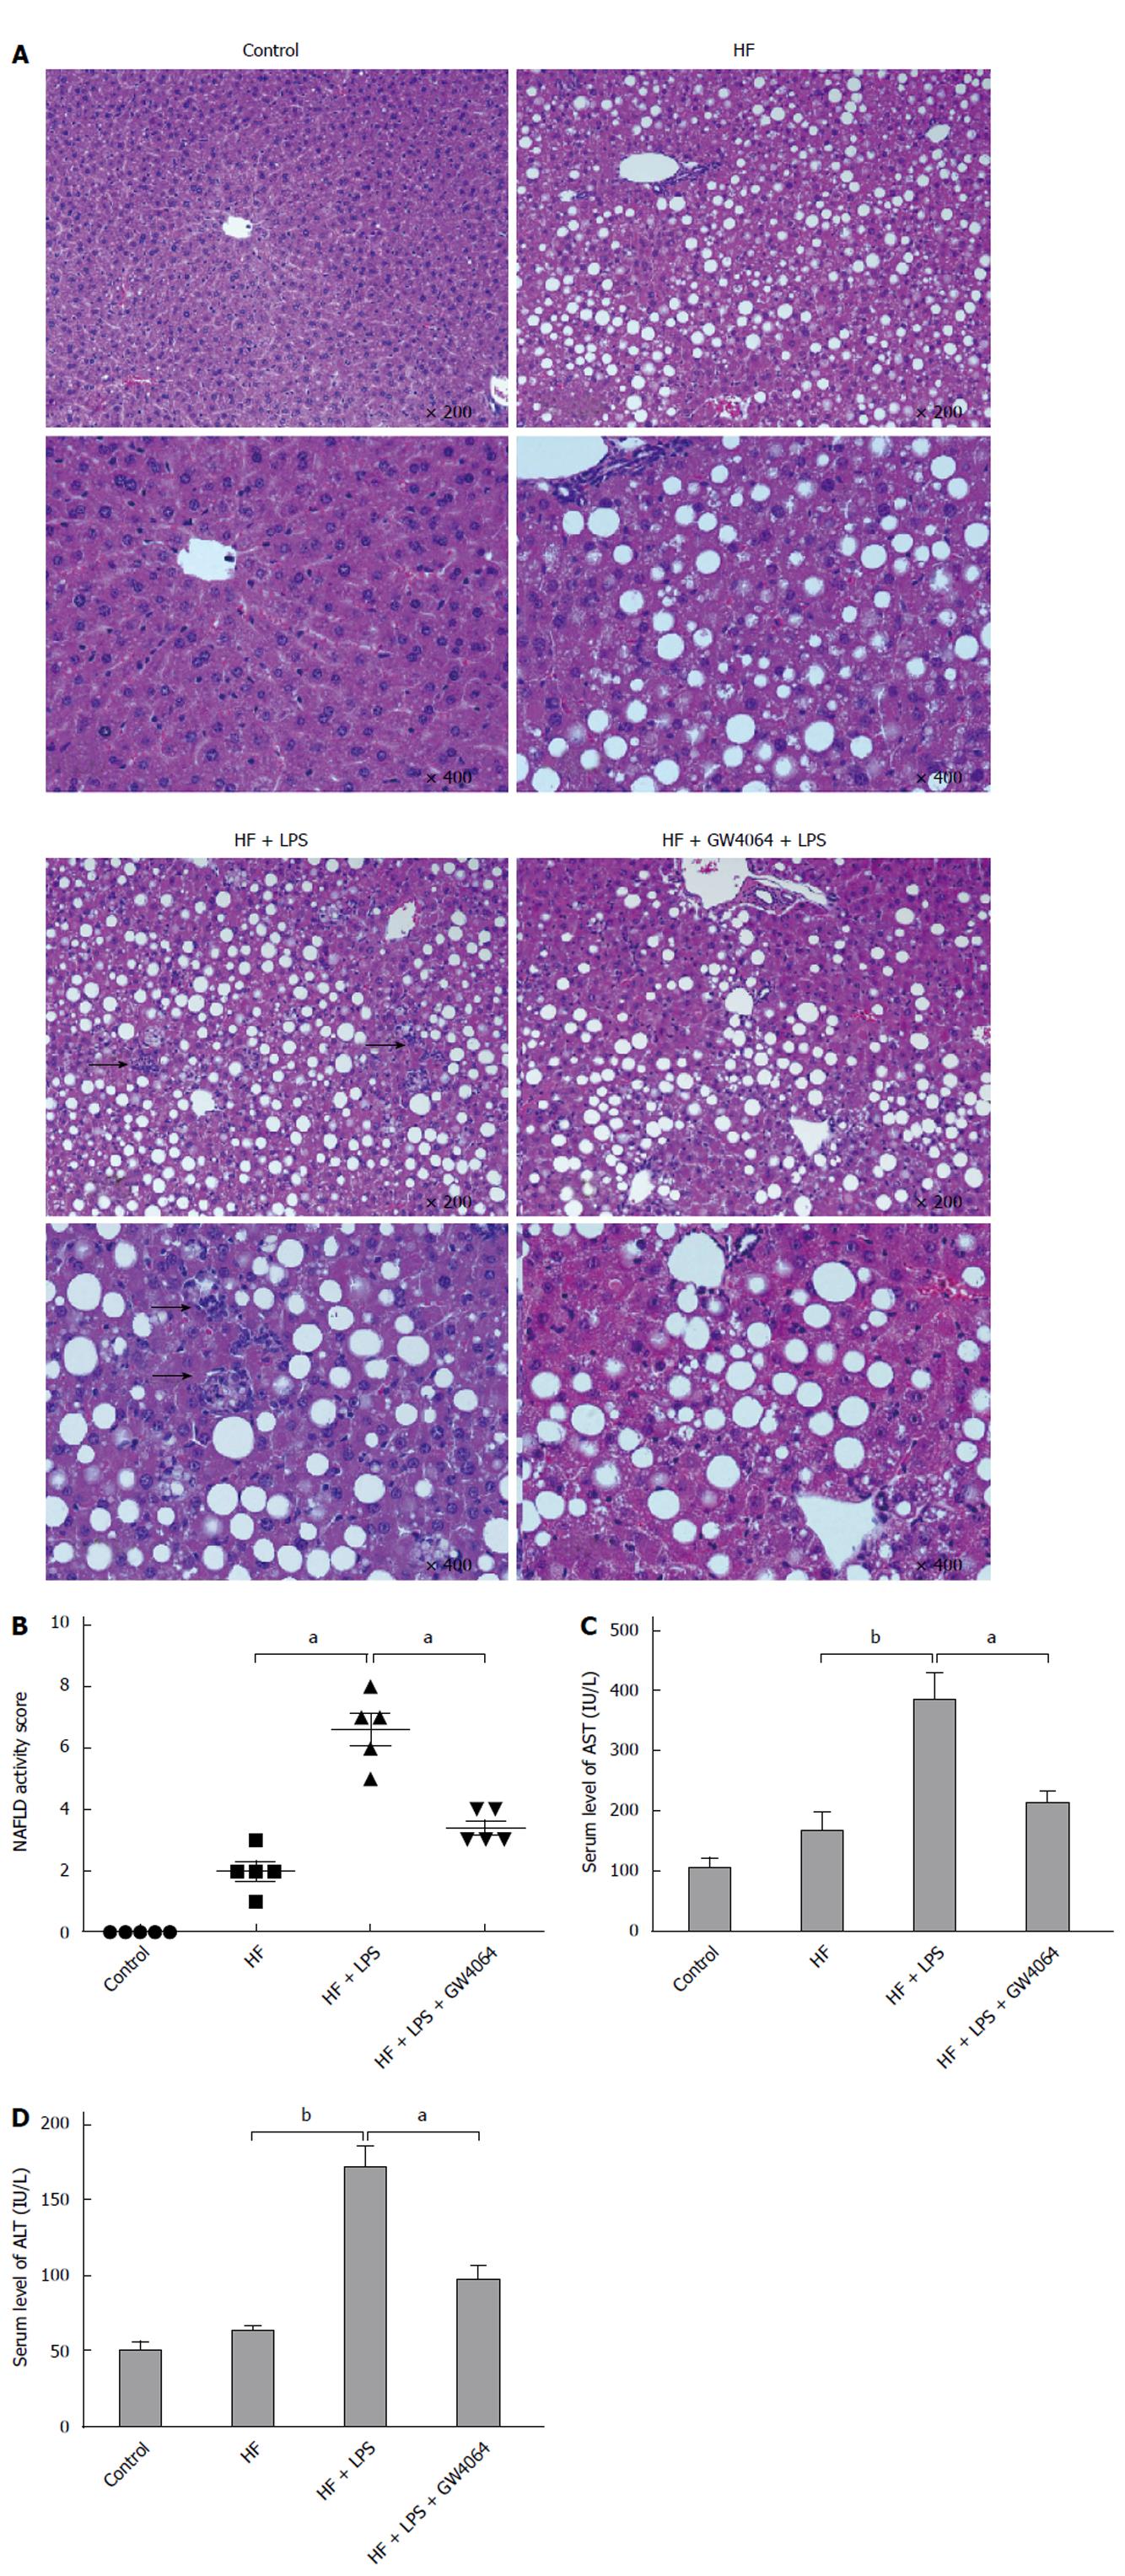
Figure 1 GW4064 alleviates lipopolysaccharide-induced liver injury in a murine nonalcoholic fatty liver disease model.
Mice fed on a high-fat (HF) diet for 8 wk received GW4064 for a week before the administration of lipopolysaccharide (LPS). Serum and liver tissues were obtained 6 h after LPS injection. A: Representative hematoxylin and eosin staining of liver sections (arrows) from normal diet, HF, HF + LPS, and HF + GW4064 + LPS mice; B: NAFLD activity scores (NAS) of normal diet, HF, HF + LPS, and HF + GW4064 + LPS mice; C: Serum levels of aspartate aminotransferase (AST) (mean ± SD) of normal diet, HF, HF + LPS, and HF + GW4064 + LPS mice (n = 5/group). aP < 0.05, bP < 0.01 vs HF + LPS group; D: Serum levels of alanine aminotransferase (ALT) (mean ± SD) of normal diet, HF, HF + LPS, and HF + GW4064 + LPS mice (n = 5/group). aP < 0.05, bP < 0.01 vs HF + LPS group.
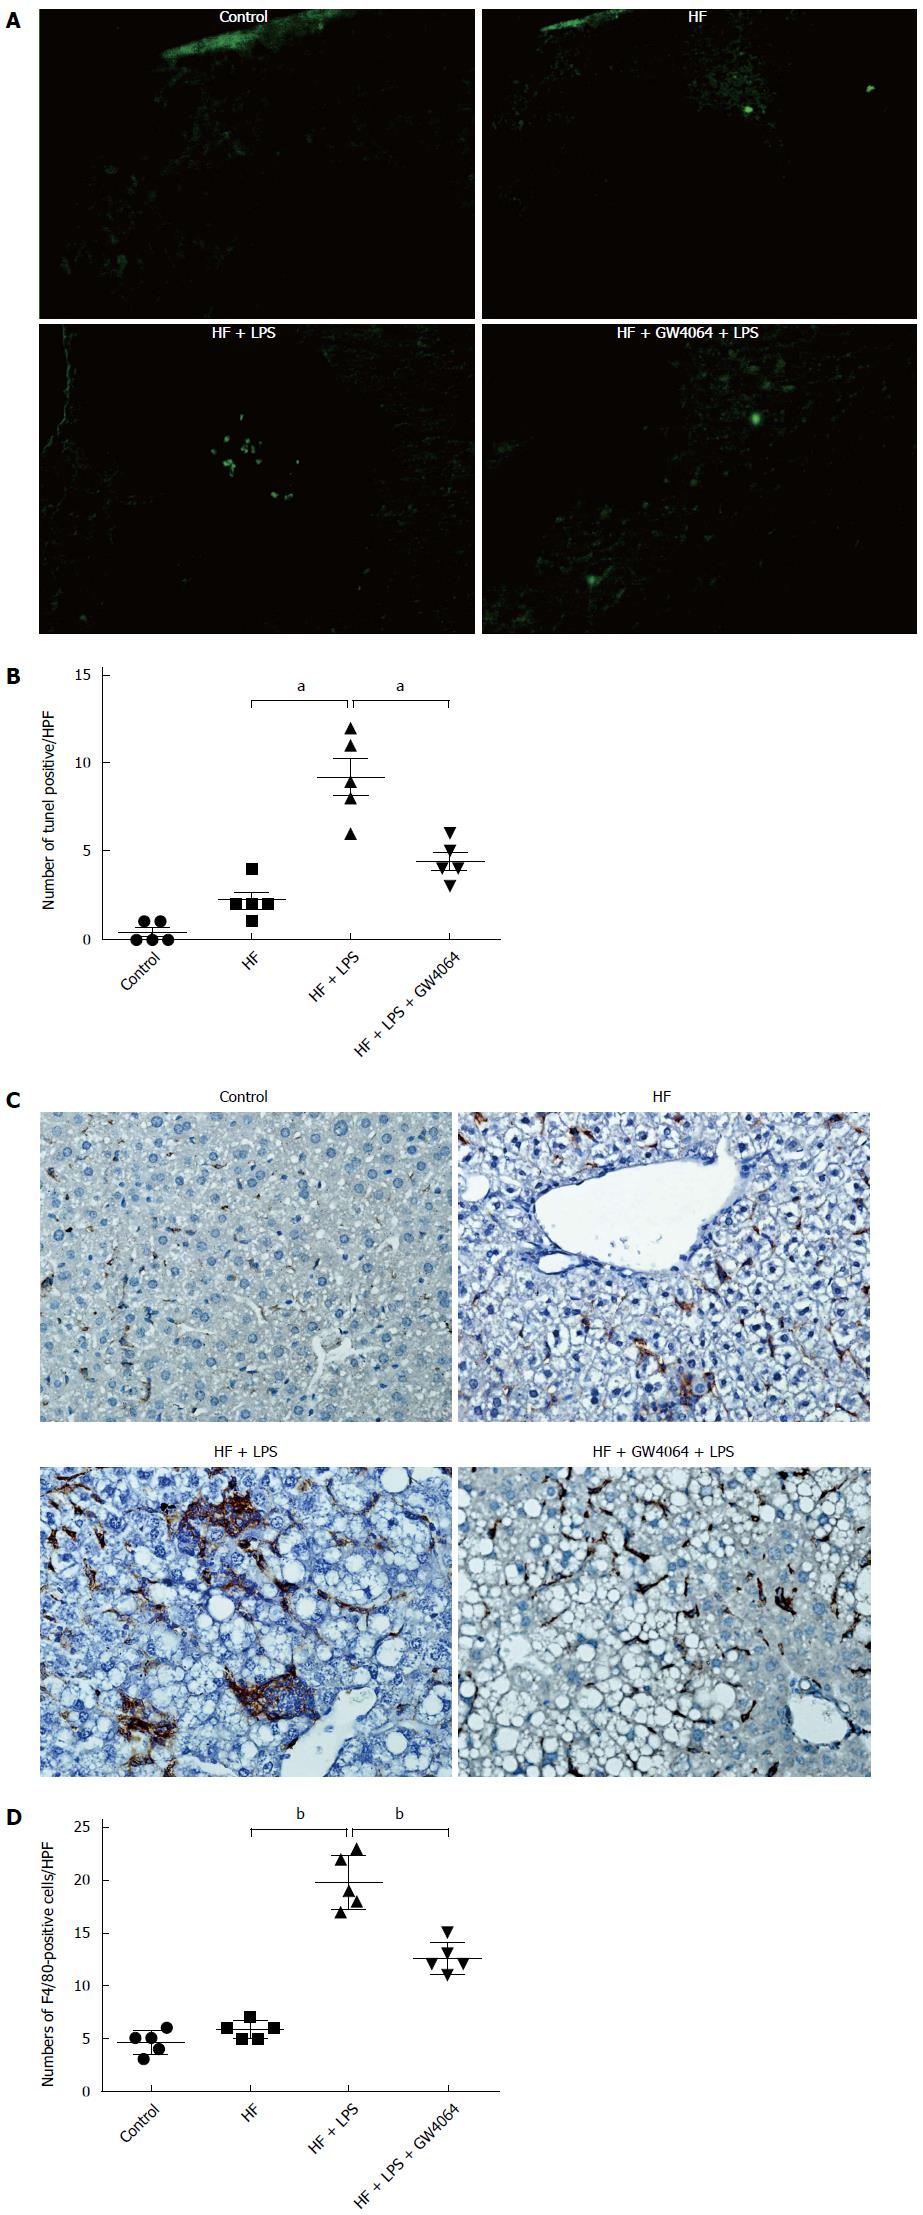
Figure 2 GW4064 reduces apoptosis and macrophage infiltration in a murine nonalcoholic fatty liver disease model.
A: Representative terminal deoxynucleotidyl transferase dUTP nick end labeling (TUNEL) staining of liver sections (magnification × 400) from normal diet, high-fat (HF), HF + lipopolysaccharide (LPS), and HF + GW4064 + LPS mice; B: Quantification of TUNEL in each high power field (HPF); C: Representative immunohistochemical staining of F4/80 in the livers (magnification × 400) of normal diet, HF, HF + LPS, and HF + GW4064 + LPS mice; D: Quantification of F4/80-positive cells in each HPF. aP < 0.05, bP < 0.01 vs HF + LPS group.
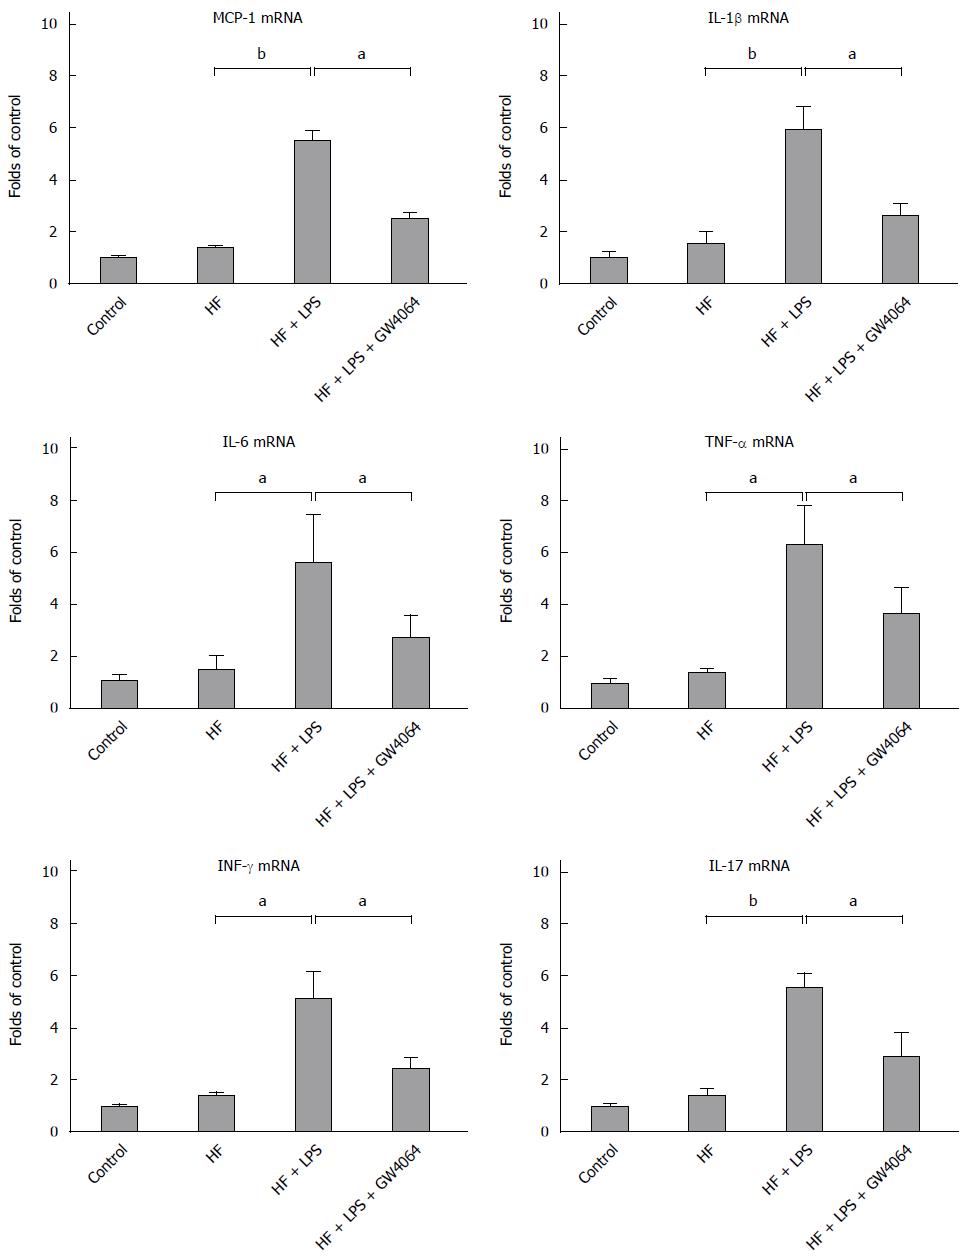
Figure 3 GW4064 reduces hepatic proinflammatory cytokine expression in a murine nonalcoholic fatty liver disease model.
RNA was extracted from the liver tissues of normal diet, high-fat (HF), HF + lipopolysaccharide (LPS), and HF + GW4064 + LPS mice. Real-time polymerase chain reaction was used to determine the mRNA levels of Tnf, Mcp1, Il1b, Il6, Il17, and Ifng. aP < 0.05, bP < 0.01 vs HF + LPS group.
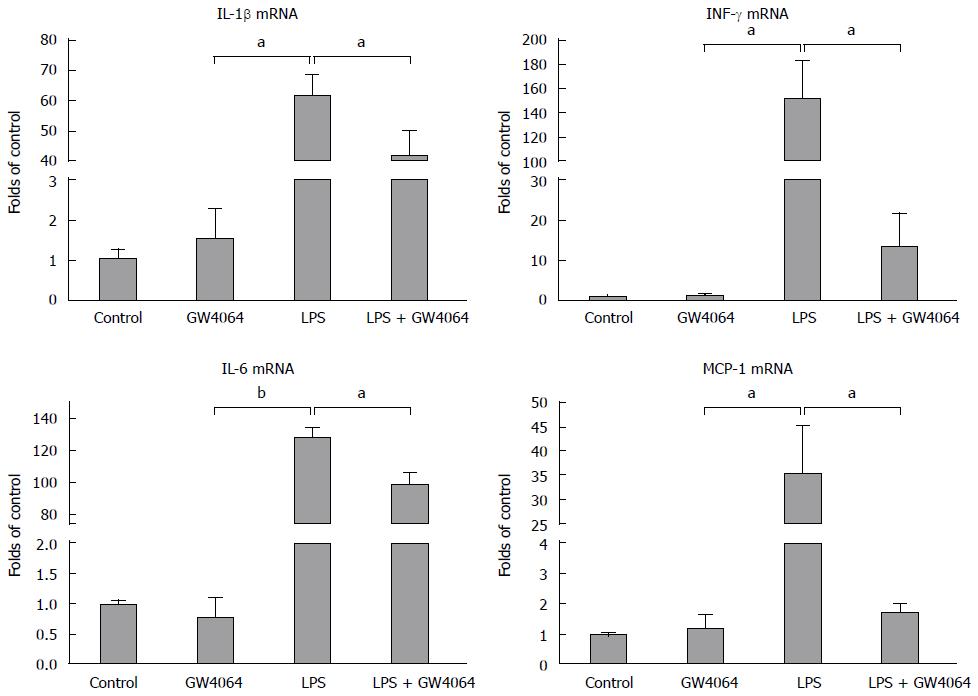
Figure 4 GW4064 represses lipopolysaccharide-induced proinflammatory cytokine expression in RAW 264.
7 cells. RAW 264.7 cells were cultured in Dulbecco's Modified Eagle Media with 10% FBS, treated with GW4064 for 24 h, then treated with lipopolysaccharide (LPS) for 6 h. Expression of Mcp1, Il1b, Il6, and Ifng in RAW 264.7 cells was evaluated by real-time polymerase chain reaction. aP < 0.05, bP < 0.01 vs LPS group.
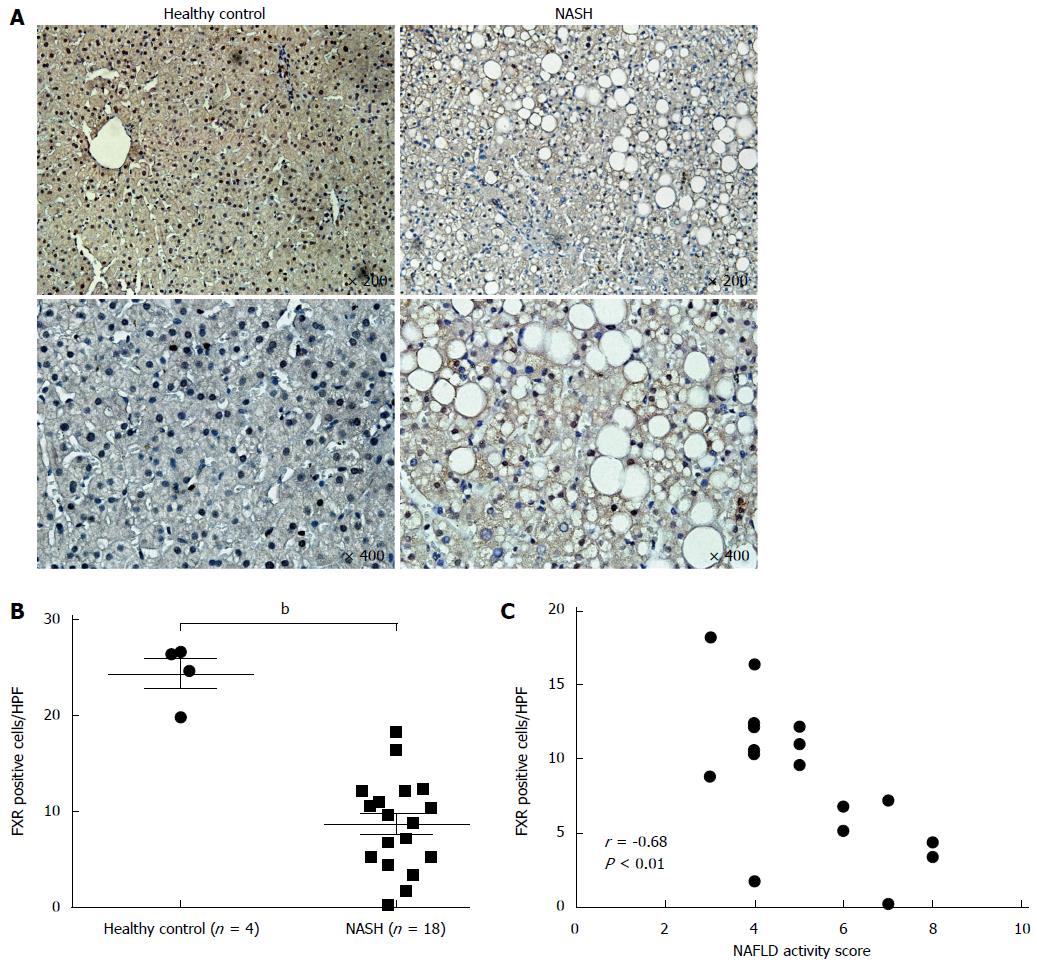
Figure 5 Farnesoid X receptor expression is decreased and inversely correlated with nonalcoholic fatty liver disease activity score in patients.
Expression of farnesoid X receptor (FXR) in patients was detected by immunohistochemical staining. A: Representative FXR staining of liver sections from healthy control subjects and patients with nonalcoholic steatohepatitis (NASH); B: Quantification of FXR-positive cells in each high power field (HPF); C: The correlation between FXR expression and nonalcoholic fatty liver disease activity score (NAS) in NASH patients. bP < 0.01 vs health control group.
- Citation: Yao J, Zhou CS, Ma X, Fu BQ, Tao LS, Chen M, Xu YP. FXR agonist GW4064 alleviates endotoxin-induced hepatic inflammation by repressing macrophage activation. World J Gastroenterol 2014; 20(39): 14430-14441
- URL: https://www.wjgnet.com/1007-9327/full/v20/i39/14430.htm
- DOI: https://dx.doi.org/10.3748/wjg.v20.i39.14430


