Copyright
©2014 Baishideng Publishing Group Inc.
World J Gastroenterol. Oct 14, 2014; 20(38): 13920-13929
Published online Oct 14, 2014. doi: 10.3748/wjg.v20.i38.13920
Published online Oct 14, 2014. doi: 10.3748/wjg.v20.i38.13920
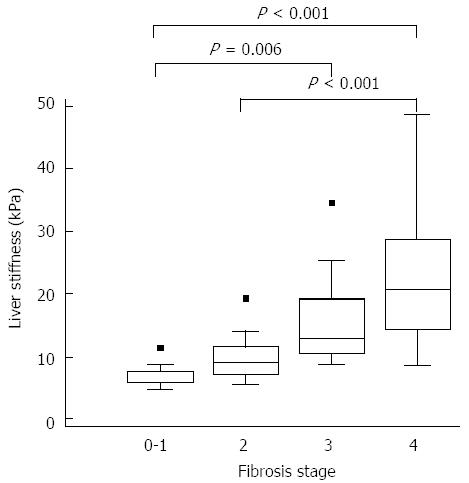
Figure 1 Score values of liver stiffness by according to fibrosis stage (n = 70).
Boxplots summarize the liver stiffness by shear wave elastography (SWE) for each fibrosis classification. For each box, the box gives the interquartile range, that is, the 25th to 75th percentiles of liver stiffness by SWE, with line inside the box denoting the median, the 50th percentile of data. Statistical significant test was done by Tukey test using ranks.
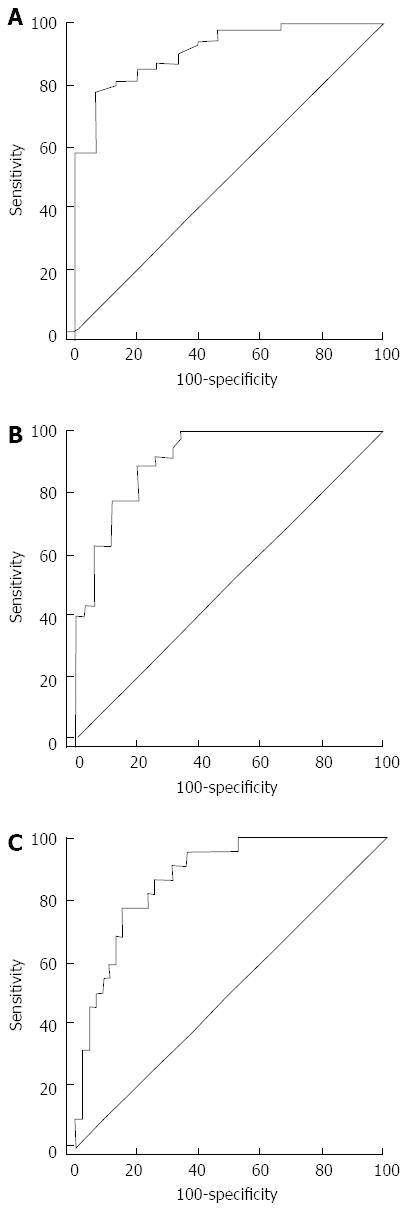
Figure 2 Receiver-operating characteristic curves of liver stiffness determined by shear wave elastography for diagnosis of significant fibrosis (F0-1 vs F2-4, A), advanced fibrosis (F0-2 vs F3-4, B) and cirrhosis (F0-3 vs F4, C) (n = 70).
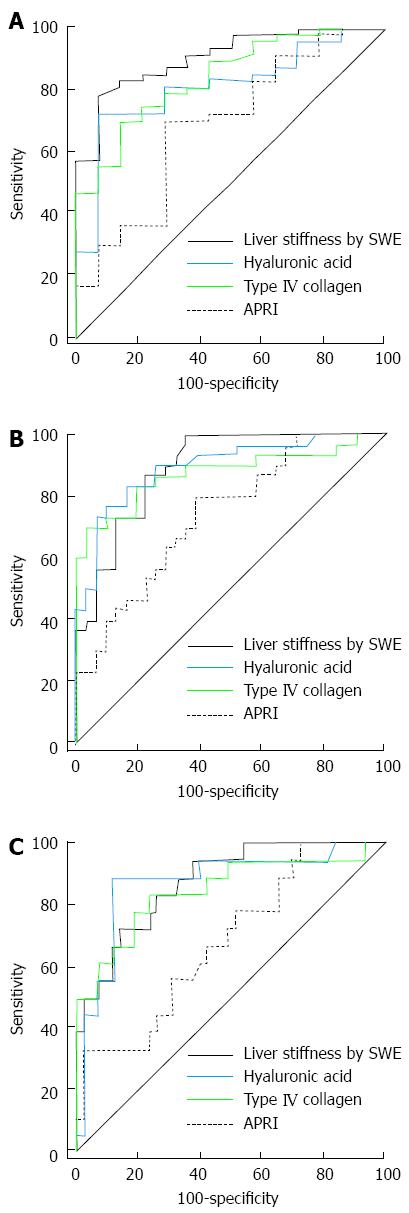
Figure 3 Receiver operating characteristic curves of noninvasive serum markers for discriminating F0-1 vs F2-4 (significant fibrosis, A), F0-2 vs F3-4 (advanced fibrosis, B) and F0-3 vs F4 (cirrhosis, C) (n = 61).
SWE: Shear wave elastography; APRI: Aspartate aminotransferase to platelet ratio index.
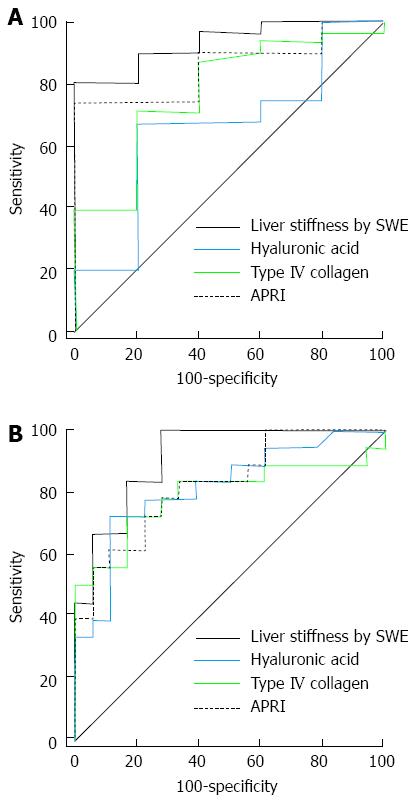
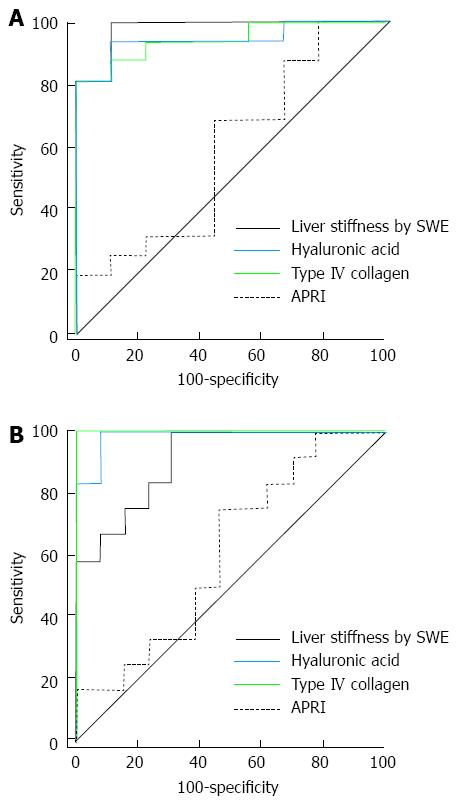
Figure 4 Comparison of receiver-operating characteristiccurves of noninvasive serum markers for discriminating F0F1 vs F2-4 (significant fibrosis, A) and F0-2 vs F3F4 (advanced fibrosis, B) in 36 patients with chronic viral hepatitis.
ROC: Receiver-operating characteristic curves; SWE: Shear wave elastography; APRI: Aspartate aminotransferase to platelet ratio index.
Figure 5 Comparison of receiver-operating characteristic curves of noninvasive marker for discriminating F0F1 vs F2-4 (significant fibrosis, A) and F0-2 vs F3F4 (advanced fibrosis, B) in 25 patients with non-viral chronic liver diseases.
ROC: Receiver-operating characteristic curves; SWE: Shear wave elastography; APRI: Aspartate aminotransferase to platelet ratio index.
- Citation: Jeong JY, Kim TY, Sohn JH, Kim Y, Jeong WK, Oh YH, Yoo KS. Real time shear wave elastography in chronic liver diseases: Accuracy for predicting liver fibrosis, in comparison with serum markers. World J Gastroenterol 2014; 20(38): 13920-13929
- URL: https://www.wjgnet.com/1007-9327/full/v20/i38/13920.htm
- DOI: https://dx.doi.org/10.3748/wjg.v20.i38.13920


