Copyright
©2014 Baishideng Publishing Group Inc.
World J Gastroenterol. Sep 7, 2014; 20(33): 11904-11909
Published online Sep 7, 2014. doi: 10.3748/wjg.v20.i33.11904
Published online Sep 7, 2014. doi: 10.3748/wjg.v20.i33.11904
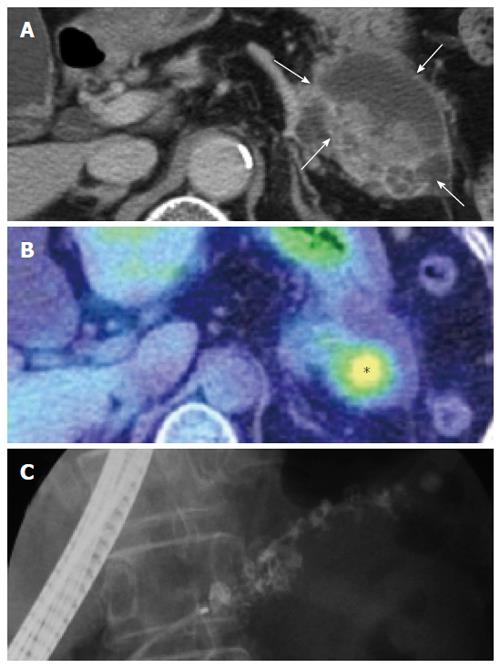
Figure 1 Diagnostic imaging before the first operation.
A: Computed tomography showed a low density area (approximately 6 cm) in the pancreas tail (arrow); B: Positron emission tomography-computed tomography showed abnormal uptake of fluorodeoxy glucose (asterisk) in the low density area observed on computed tomography; C: Endoscopic retrograde cholangiopancreatography showed irregular dilatation of the main pancreatic duct in the body and tail.
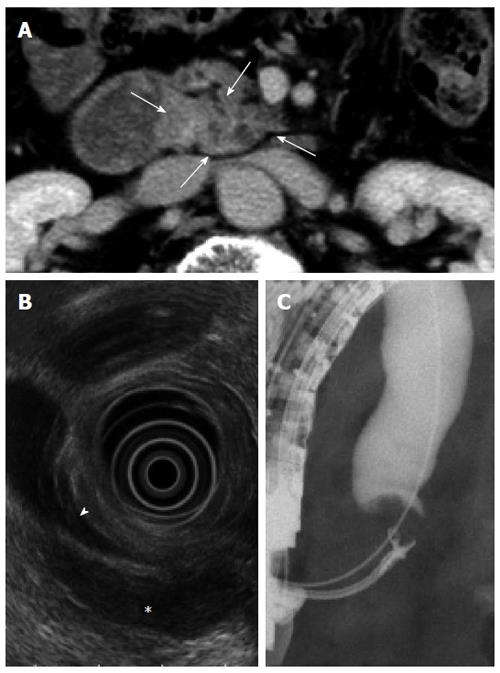
Figure 2 Diagnostic imaging before the second operation.
A: Computed tomography showed a low density area at the uncus of the pancreas (arrow); B: Endoscopic ultrasound showed a 3 cm hypoechoic mass (asterisk) at the main pancreatic duct near the common bile duct (arrowhead); C: Endoscopic retrograde cholangiopancreatography showed the presence of inferior common bile duct stenosis.
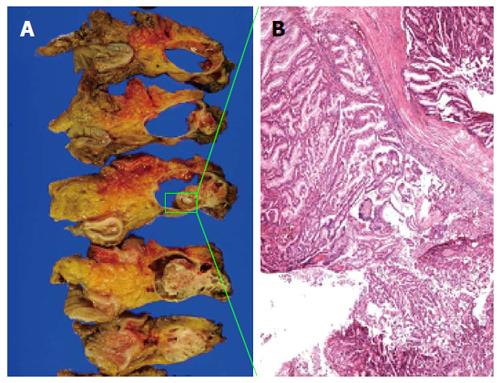
Figure 3 The resected specimen and pathological findings from the first operation.
A: The resected specimen had a cystic lesion with a solid component; B: HE staining showed a mucus-type epithelium with an extension of intraductal papillary growth of the tumor cells. Scarce mucus-producing cells were also present (HE, × 40).
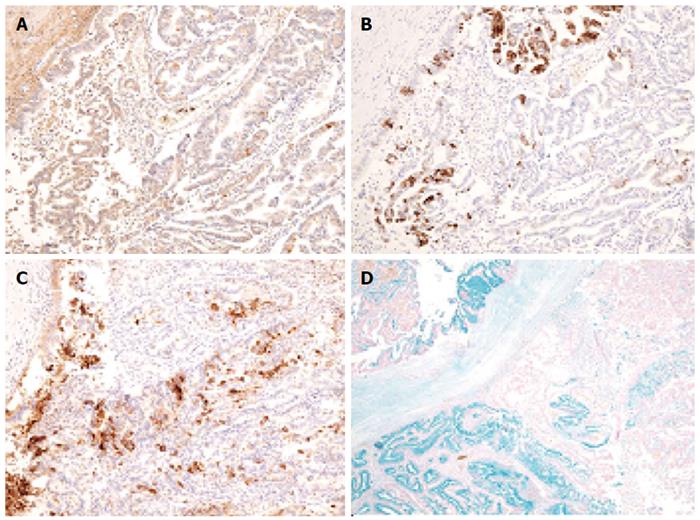
Figure 4 Immunohistochemical and pathological findings from the first operation.
A: α1-antitrypsin (× 100): regions of both strongly positive and weakly positive cells were present; B: Mucin5AC (× 100): only part of the tumor was positive; C: Carcinoembryonic antigen (× 100): a portion of the tumor was positive; D: Alcian blue (× 100): staining was positive in the region with poor mucus production.
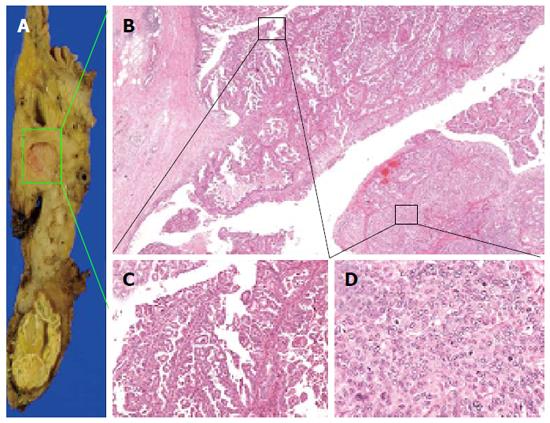
Figure 5 The resected specimen and pathological findings from the second operation.
A: The resected specimen from the second operation showed a 3 cm solid mass in the head of the pancreas; B: There was a region with acinar-like structures (bottom right) that showed papillary growth (upper left) (HE, × 40); C: Dysplastic cells with poor mucus production exhibited papillary proliferation (HE, × 200); D: Acinar structures and cell division were observed (HE, × 400).
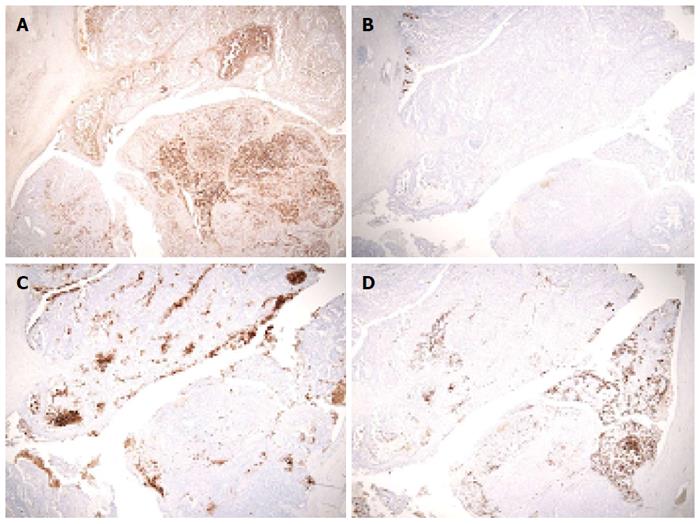
Figure 6 Immunohistochemical and pathological findings from the second operation.
A: α1-antitrypsin (× 40): the acinar structure in the lower right area was strongly positive; B: Mucin5AC (× 40): only a small part of the tumor was positively stained; C: Carcinoembryonic antigen (× 40): only a portion of the area was positively stained; D: Mucin1 (× 40): some positive staining was observed.
- Citation: Shonaka T, Inagaki M, Akabane H, Yanagida N, Shomura H, Yanagawa N, Oikawa K, Nakano S. Total pancreatectomy for metachronous mixed acinar-ductal carcinoma in a remnant pancreas. World J Gastroenterol 2014; 20(33): 11904-11909
- URL: https://www.wjgnet.com/1007-9327/full/v20/i33/11904.htm
- DOI: https://dx.doi.org/10.3748/wjg.v20.i33.11904


