Copyright
©2014 Baishideng Publishing Group Inc.
World J Gastroenterol. Sep 7, 2014; 20(33): 11793-11799
Published online Sep 7, 2014. doi: 10.3748/wjg.v20.i33.11793
Published online Sep 7, 2014. doi: 10.3748/wjg.v20.i33.11793
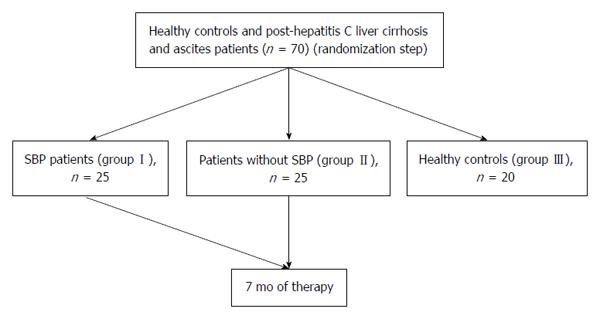
Figure 1 Algorithm for the study design.
SBP: Spontaneous bacterial peritonitis.
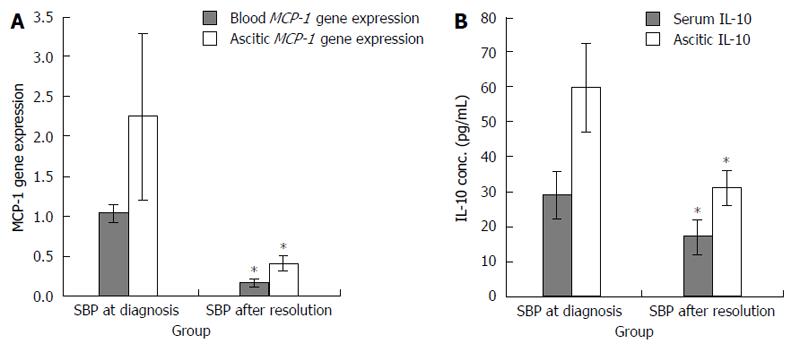
Figure 2 Cirrhotic patients with spontaneous bacterial peritonitis before and after therapy.
A: Blood and ascitic MCP-1 gene expression; B: Serum and ascetic IL-10 concentrations. Results are expressed as mean ± SD. Asterisk denotes a significant difference in measured parameters at diagnosis and after resolution. MCP-1: Monocyte chemotactic protein-1; IL-10: Interleukin 10; SBP: Spontaneous bacterial peritonitis.
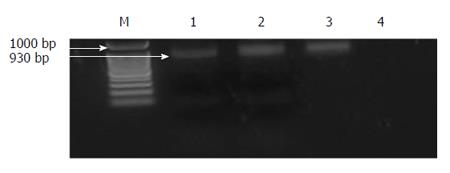
Figure 3 Agarose gel electrophoresis analysis of polymerase chain reaction products for MCP-1 gene (930 bp) before digestion with restriction enzyme.
Lane M: DNA ladder (100, 200, 300 to 1000 bp); Lane 1: polymerase chain reaction (PCR) product for MCP-1 gene in a healthy control; Lane 2: PCR product for MCP-1 gene in a cirrhotic patient with SBP; Lane 3: PCR product for MCP-1 gene in a cirrhotic patient without SBP; Lane 4: Negative control. MCP-1: Monocyte chemotactic protein-1; SBP: Spontaneous bacterial peritonitis.
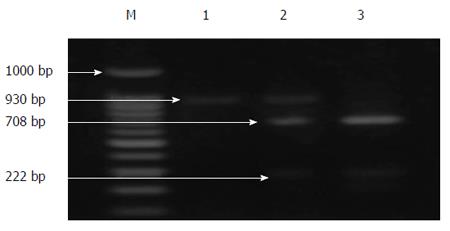
Figure 4 Agarose gel electrophoresis analysis of polymerase chain reaction products for MCP-1 gene (930 bp) after digestion with restriction enzyme.
Lane M: DNA ladder (100, 200, 300 to 1000 bp); Lane 1: polymerase chain reaction (PCR) product for A/A genotype (930 bp); Lane 2: PCR product for A/G genotype (930, 708 and 222 bp); Lane 3: PCR product for G/G genotype (708 and 222 bp). MCP-1: Monocyte chemotactic protein-1.
- Citation: Salama MK, Sabry D, Al-Ghussein MA, Ahmed R, AbdAllah S, Taha FM, Fathy W, Wadie MS, Nabih M, Abul-Fotouh A, Darwish T. Molecular detection of monocyte chemotactic protein-1 polymorphism in spontaneous bacterial peritonitis patients. World J Gastroenterol 2014; 20(33): 11793-11799
- URL: https://www.wjgnet.com/1007-9327/full/v20/i33/11793.htm
- DOI: https://dx.doi.org/10.3748/wjg.v20.i33.11793


