Copyright
©2014 Baishideng Publishing Group Inc.
World J Gastroenterol. Sep 7, 2014; 20(33): 11753-11761
Published online Sep 7, 2014. doi: 10.3748/wjg.v20.i33.11753
Published online Sep 7, 2014. doi: 10.3748/wjg.v20.i33.11753
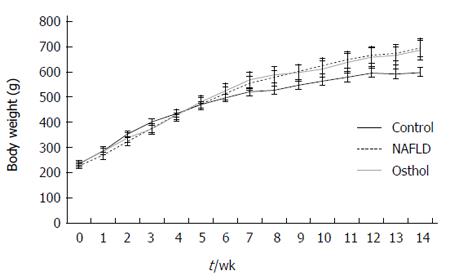
Figure 1 Changes in body weight of control, non-alcoholic fatty liver disease and osthol groups.
NAFLD: Non-alcoholic fatty liver disease.
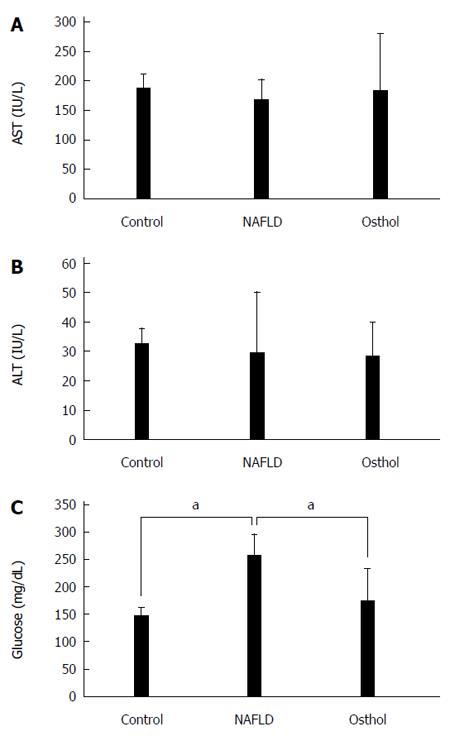
Figure 2 Effect of osthol on serum aspartate transaminase/alanine transaminase and glucose levels.
Changes in serum ASLT/ALT of control, non-alcoholic fatty liver disease (NAFLD) and osthol groups (A and B). Osthol treatment decreased serum glucose levels (C). AST: Aspartate aminotransferase; ALT: Alanine aminotransferase. aP < 0.05.
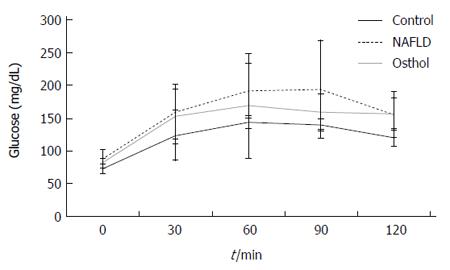
Figure 3 Changes in serum glucose levels following the oral glucose tolerance test.
NAFLD: Non-alcoholic fatty liver disease.
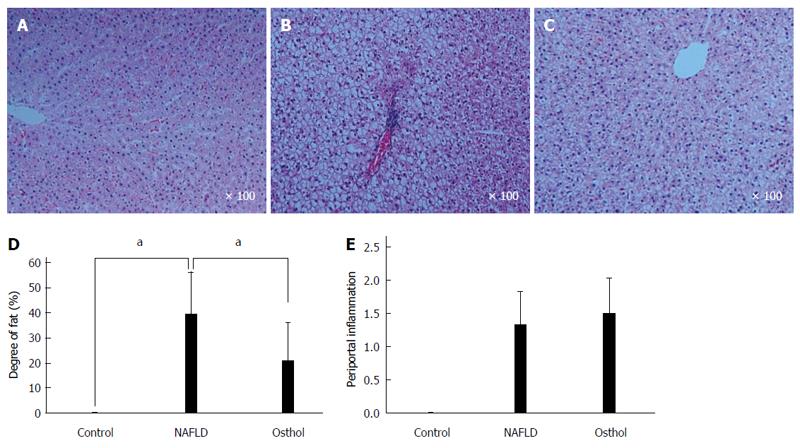
Figure 4 Effect of osthol on liver histology.
Hematoxylin and eosin staining showing the difference in periportal inflammation and fat content between control, NAFLD and osthol groups (A-E). aP < 0.05.
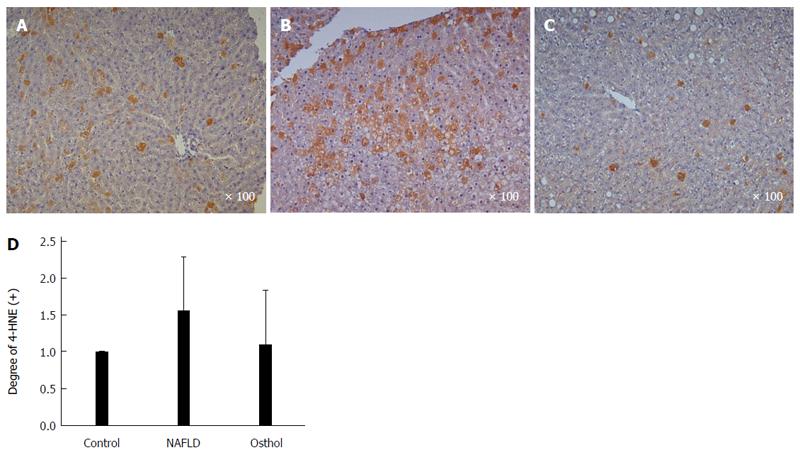
Figure 5 4-hydroxynonenal immunohistostaining comparing control, non-alcoholic fatty liver disease, and osthol groups (A-D).
The NAFLD group shows increased 4-hydroxynonenal (4-HNE) immunohistostaining compared with the osthol group. NAFLD: Non-alcoholic fatty liver disease.
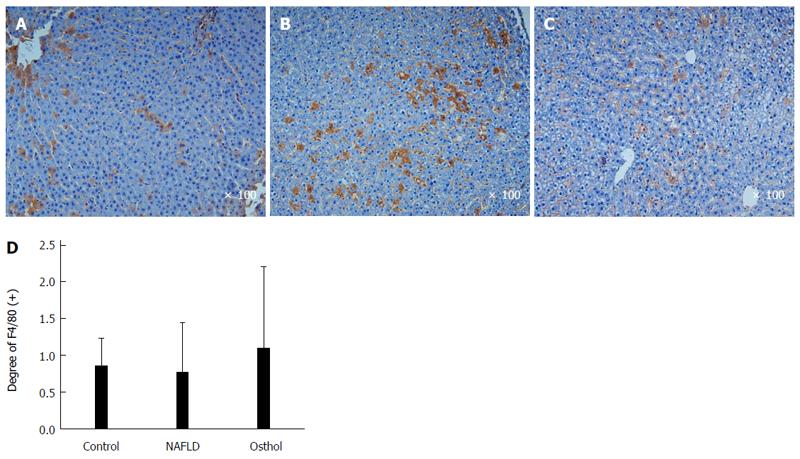
Figure 6 F4/80 immunohistostaining comparing control, non-alcoholic fatty liver disease, and osthol groups showing no significant difference between the groups (A-C).
NAFLD: Non-alcoholic fatty liver disease.
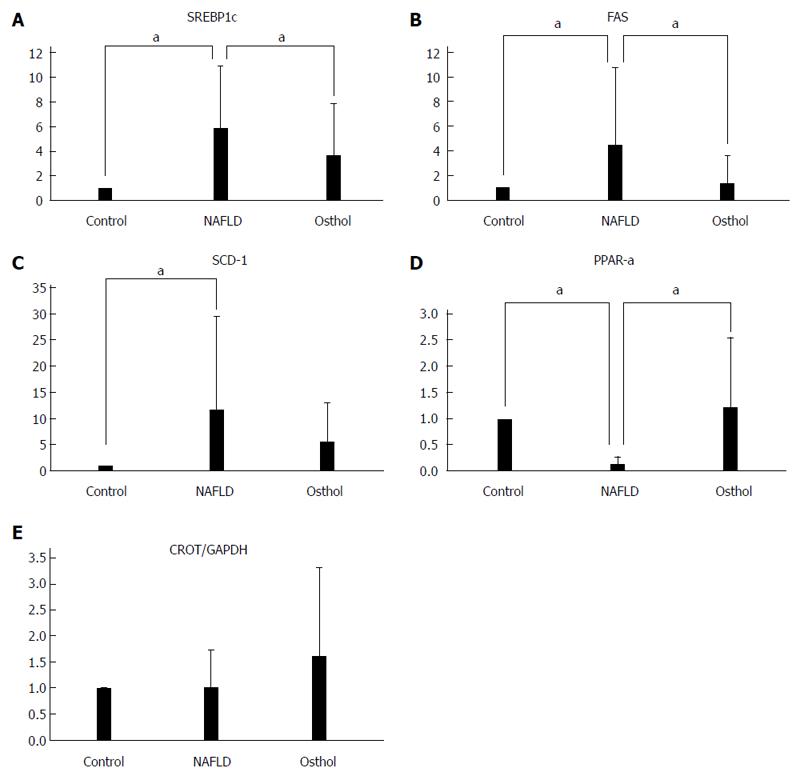
Figure 7 Polymerase chain reaction expressions of SREBP1c, FAS, SCD-1, PPAR-α and CROT.
Compared with the NAFLD group, osthol treatment decreased SREBP1c, FAS, and SCD-1 expression (A-C), and increased PPAR-α and CROT expression (D and E). aP < 0.05.
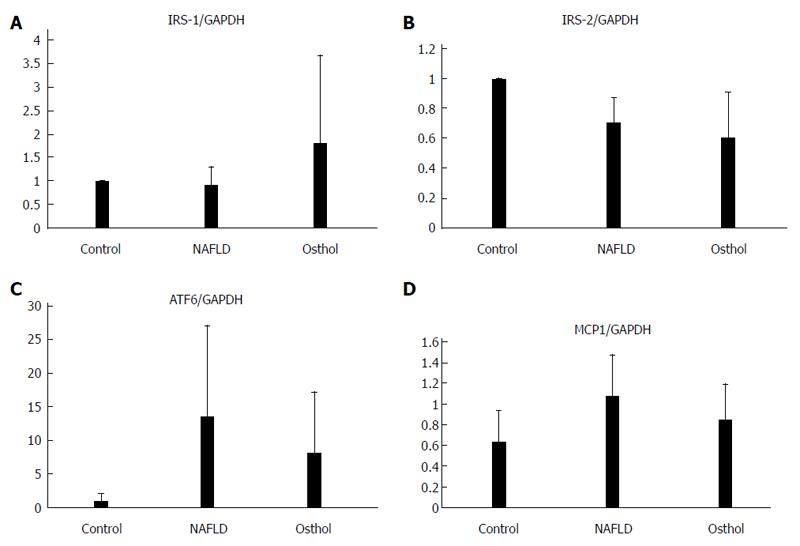
Figure 8 Polymerase chain reaction expressions of IRS-1, IRS-2, ATF6 and MCP-1 (A-D) showing no statistically significant differences between the groups.
-
Citation: Nam HH, Jun DW, Jeon HJ, Lee JS, Saeed WK, Kim EK. Osthol attenuates hepatic steatosis
via decreased triglyceride synthesis not by insulin resistance. World J Gastroenterol 2014; 20(33): 11753-11761 - URL: https://www.wjgnet.com/1007-9327/full/v20/i33/11753.htm
- DOI: https://dx.doi.org/10.3748/wjg.v20.i33.11753


