Copyright
©2014 Baishideng Publishing Group Inc.
World J Gastroenterol. Aug 28, 2014; 20(32): 11384-11393
Published online Aug 28, 2014. doi: 10.3748/wjg.v20.i32.11384
Published online Aug 28, 2014. doi: 10.3748/wjg.v20.i32.11384
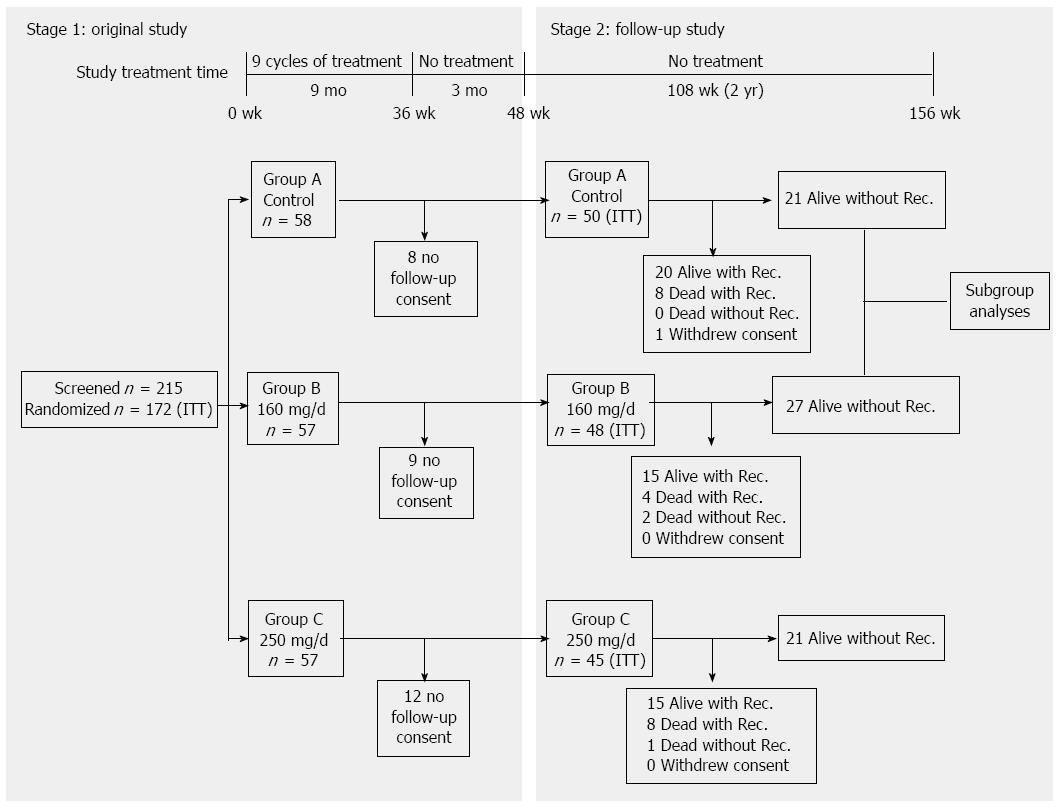
Figure 1 Graphic representation of phase II and follow-up study design, timeline and cohort relationships.
ITT: Intent-to-treat; Rec.: Recovery.
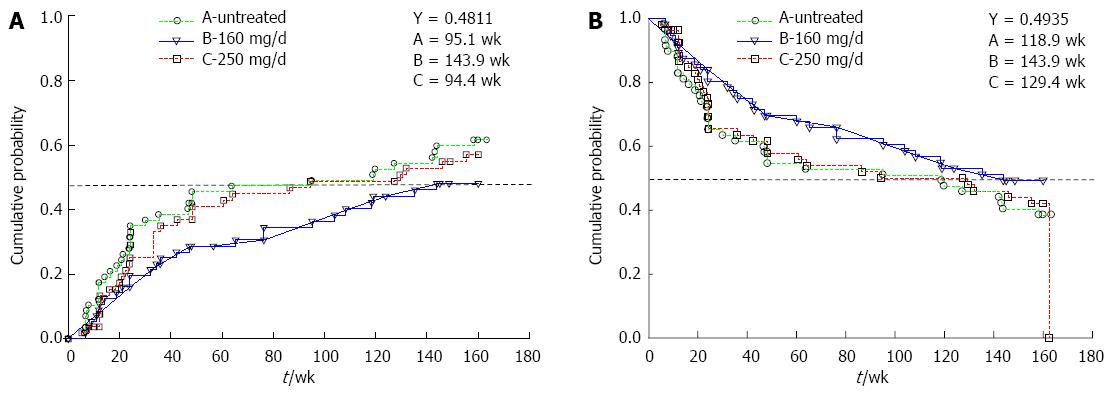
Figure 2 3-year probability for Groups A, B and C.
A: Time-to-recurrence; B: Disease-free survival.
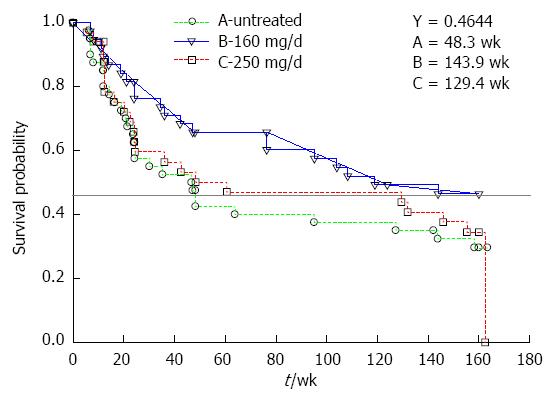
Figure 3 Subgroup analysis of 3-year disease-free survival probability for high-risk subgroups in Groups A, B and C.
- Citation: Liu CJ, Chang J, Lee PH, Lin DY, Wu CC, Jeng LB, Lin YJ, Mok KT, Lee WC, Yeh HZ, Ho MC, Yang SS, Yang MD, Yu MC, Hu RH, Peng CY, Lai KL, Chang SSC, Chen PJ. Adjuvant heparanase inhibitor PI-88 therapy for hepatocellular carcinoma recurrence. World J Gastroenterol 2014; 20(32): 11384-11393
- URL: https://www.wjgnet.com/1007-9327/full/v20/i32/11384.htm
- DOI: https://dx.doi.org/10.3748/wjg.v20.i32.11384


