Copyright
©2014 Baishideng Publishing Group Inc.
World J Gastroenterol. Aug 21, 2014; 20(31): 10984-10993
Published online Aug 21, 2014. doi: 10.3748/wjg.v20.i31.10984
Published online Aug 21, 2014. doi: 10.3748/wjg.v20.i31.10984
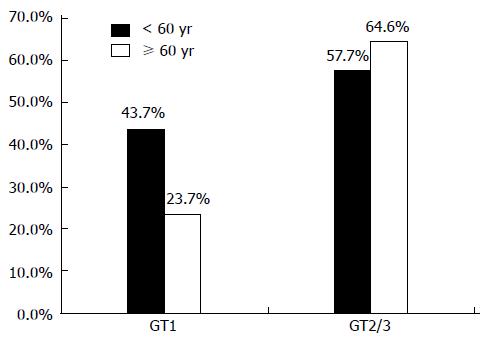
Figure 1 Sustained virological response rates in percent for different genotypes: comparison of patients < 60 years vs≥ 60 years with chronic hepatitis C.
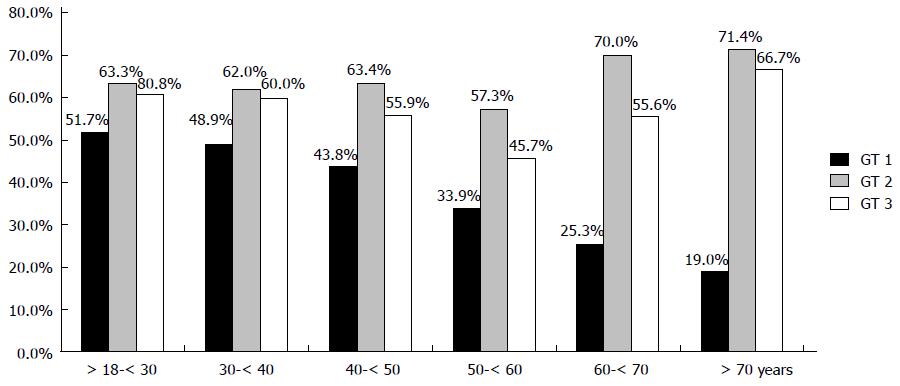
Figure 2 Sustained virological response rates in % for different age groups and different genotypes for patients with chronic hepatitis C.
- Citation: Roeder C, Jordan S, Schulze zur Wiesch J, Pfeiffer-Vornkahl H, Hueppe D, Mauss S, Zehnter E, Stoll S, Alshuth U, Lohse AW, Lueth S. Age-related differences in response to peginterferon alfa-2a/ribavirin in patients with chronic hepatitis C infection. World J Gastroenterol 2014; 20(31): 10984-10993
- URL: https://www.wjgnet.com/1007-9327/full/v20/i31/10984.htm
- DOI: https://dx.doi.org/10.3748/wjg.v20.i31.10984


