Copyright
©2014 Baishideng Publishing Group Inc.
World J Gastroenterol. Aug 21, 2014; 20(31): 10895-10899
Published online Aug 21, 2014. doi: 10.3748/wjg.v20.i31.10895
Published online Aug 21, 2014. doi: 10.3748/wjg.v20.i31.10895
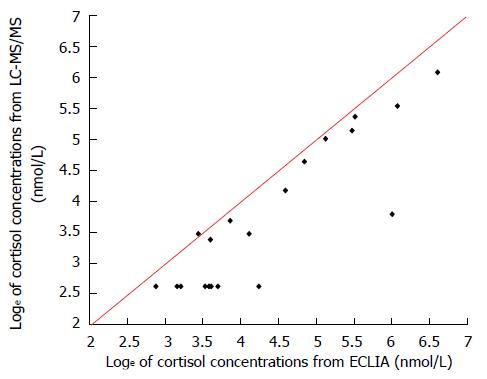
Figure 1 Cortisol concentrations plot with electrochemiluminescence immunoassay vs liquid chromatography-tandem mass spectrometry loge- transformed data.
LC-MS/MS: Liquid chromatographic methods coupled with mass spectrometry detection; ECLIA: Electrochemiluminescence immunoassay.
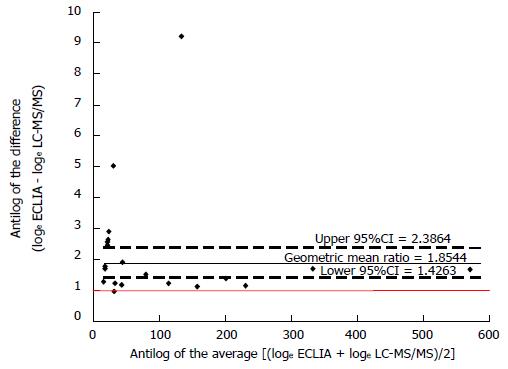
Figure 2 Difference between electrochemiluminescence immunoassay and liquid chromatography-tandem mass spectrometry methods using loge-transformed data.
LC-MS/MS: Liquid chromatographic methods coupled with mass spectrometry detection; ECLIA: Electrochemiluminescence immunoassay.
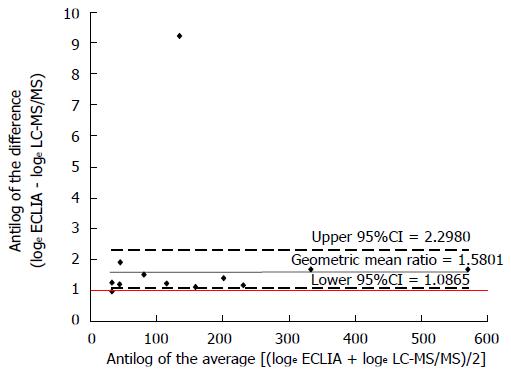
Figure 3 Difference between electrochemiluminescence immunoassay and liquid chromatography-tandem mass spectrometry methods using loge-transformed data in the 12 patients with cortisol levels below the limit of quantification.
LC-MS/MS: Liquid chromatographic methods coupled with mass spectrometry detection; ECLIA: Electrochemiluminescence immunoassay.
- Citation: Manguso F, Bennato R, Lombardi G, Viola A, Riccio E, Cipolletta L. Electrochemiluminescence immunoassay method underestimates cortisol suppression in ulcerative colitis patients treated with oral prednisone. World J Gastroenterol 2014; 20(31): 10895-10899
- URL: https://www.wjgnet.com/1007-9327/full/v20/i31/10895.htm
- DOI: https://dx.doi.org/10.3748/wjg.v20.i31.10895


