Copyright
©2014 Baishideng Publishing Group Inc.
World J Gastroenterol. Aug 7, 2014; 20(29): 10193-10201
Published online Aug 7, 2014. doi: 10.3748/wjg.v20.i29.10193
Published online Aug 7, 2014. doi: 10.3748/wjg.v20.i29.10193
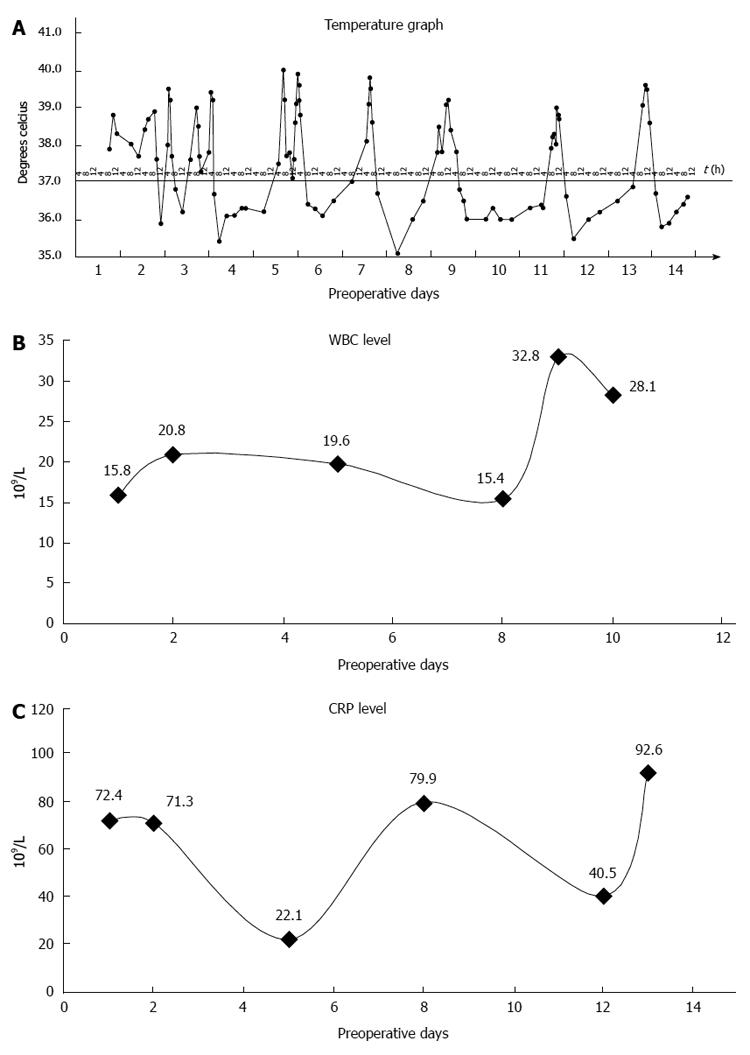
Figure 1 Preoperative graphs.
A: Preoperative temperature; B: Preoperative white blood cell (WBC) count; C: C-reactive protein (CRP) level.
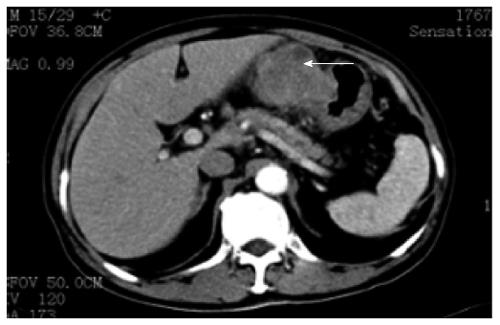
Figure 2 Abdominal computed tomography showing an upper abdominal mass between left lateral hepatic lobe and stomach, as shown by arrow.
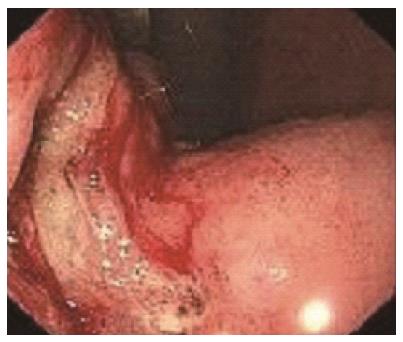
Figure 3 Gastroscopy.
Gastric antrum raised lesion, with ulceration, easy to bleed and involving the lower part of the body of the stomach.
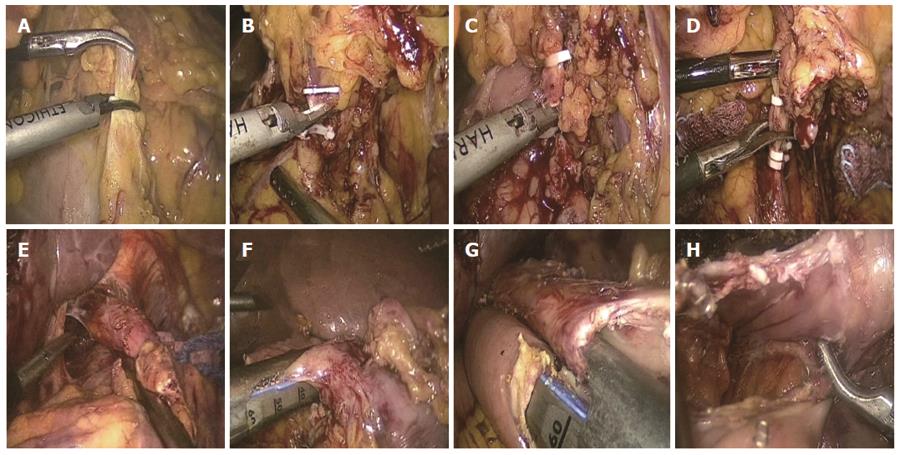
Figure 4 Surgical procedure.
A: Dissection of the greater omentum; B, C: Clipping and cutting of right gastroepiploic vein and artery, respectively; D: Clipping and cutting of left gastric artery; E: Mobilization of esophagus; F: Transection of duodenum; G: Antiperistaltic reconstruction of esophagus and jejunum using linear stapler; H: Entry hole as seen after stapling.
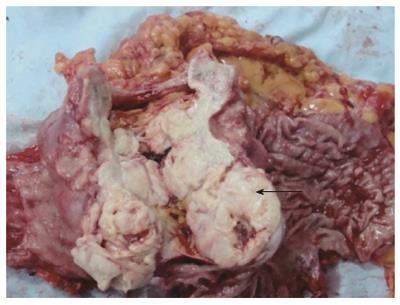
Figure 5 Gross Operative specimen.
An 8 cm × 7.5cm mass with a 3 cm × 2 cm ulcer, invading the serosal layer (mass cut open), as shown by arrow.
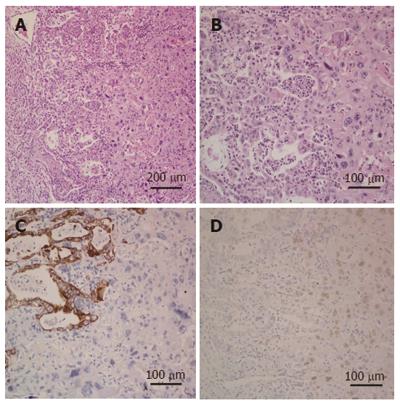
Figure 6 Microscopic specimen.
A and B: Both adenocarcinoma and squamous cell carcinoma components. Adenocarcinoma component shows gland formation and squamous carcinoma component shows keratinization (hematoxylin and eosin staining, A: × 10 magnification; B: × 20 magnification); C: Immunohistochemical (IHC) staining for cytokeratin (low), on the left side adenocarcinoma is strongly positive and on the right side squamous cell carcinoma is negative (IHC × 20 magnification); D: IHC staining for P63, on the left side adenocarcinoma is negative and on the right side squamous cell carcinoma is nuclear positive (IHC × 20 magnification).
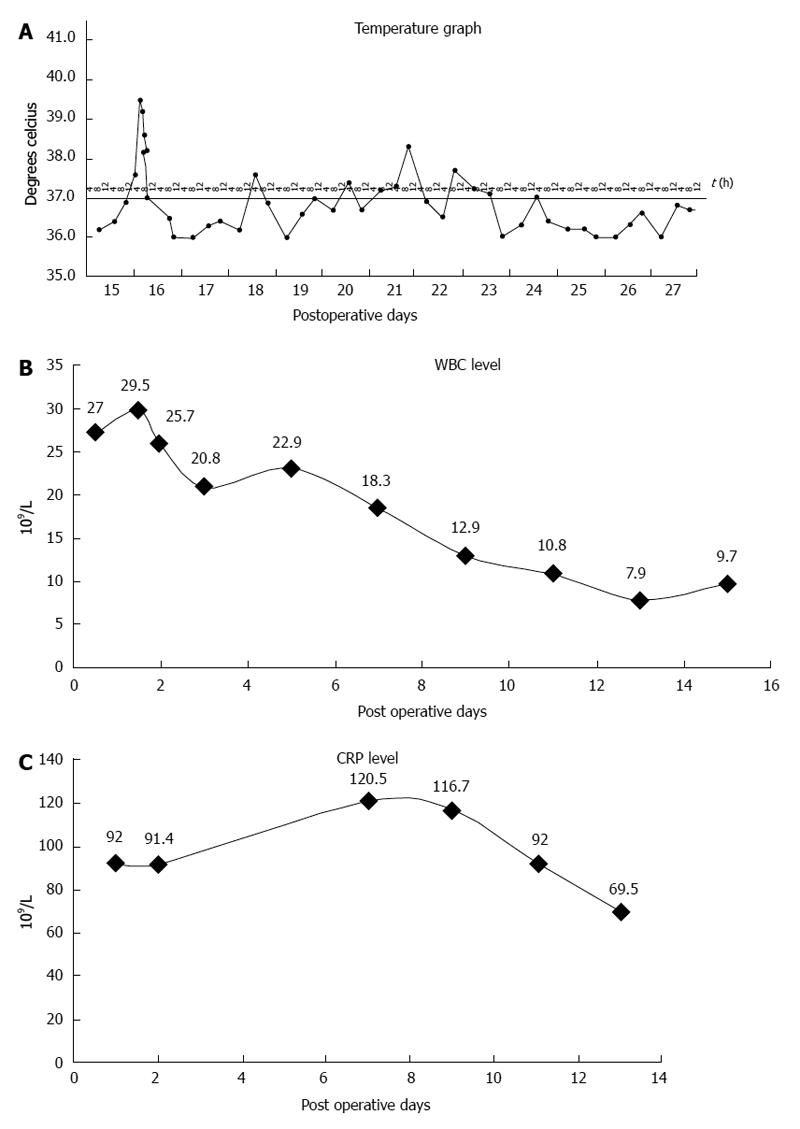
Figure 7 Postoperative graphs.
A: Postoperative temperature; B: Postoperative white blood cell (WBC) count; C: Postoperative C-reactive protein (CRP) level.
- Citation: Ajoodhea H, Zhang RC, Xu XW, Jin WW, Chen K, He YT, Mou YP. Fever as a first manifestation of advanced gastric adenosquamous carcinoma: A case report. World J Gastroenterol 2014; 20(29): 10193-10201
- URL: https://www.wjgnet.com/1007-9327/full/v20/i29/10193.htm
- DOI: https://dx.doi.org/10.3748/wjg.v20.i29.10193


