Copyright
©2014 Baishideng Publishing Group Inc.
World J Gastroenterol. Jul 28, 2014; 20(28): 9261-9269
Published online Jul 28, 2014. doi: 10.3748/wjg.v20.i28.9261
Published online Jul 28, 2014. doi: 10.3748/wjg.v20.i28.9261
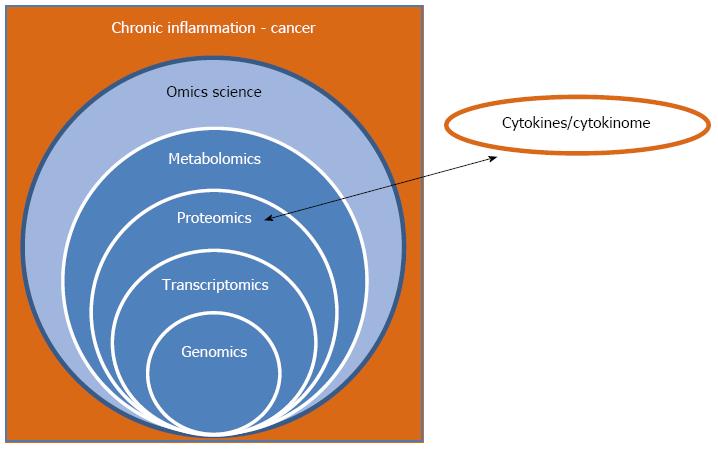
Figure 1 Relationship of the “omics sciences”, chronic inflammation, and cancer.
The scheme shows (1) the necessity to integrate data derived from all the “omics sciences” for obtaining a complete picture of the system; and (2) the importance of including the cytokinome profile, at the proteomics level, due to the crucial role of cytokines in the chronic inflammation process leading to cancer.
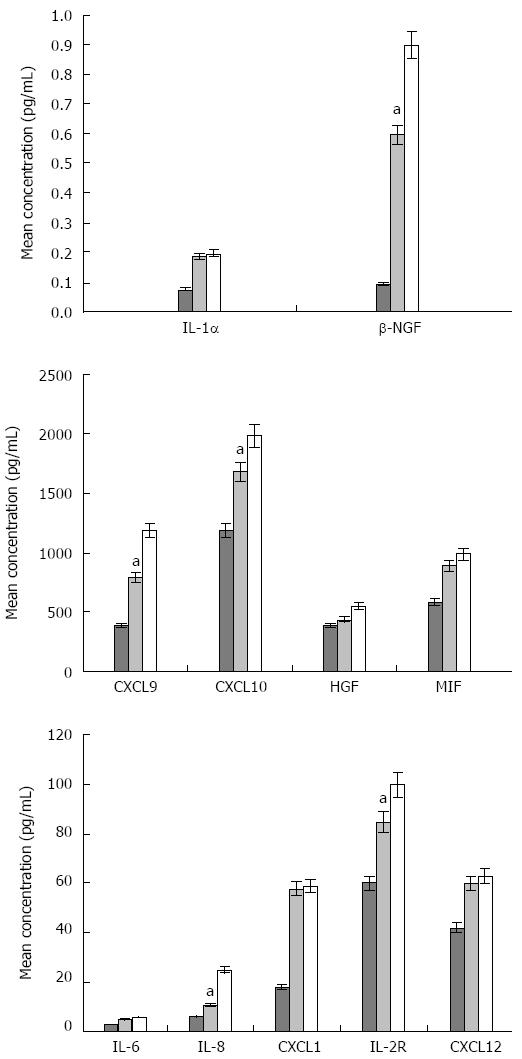
Figure 2 Differences in the concentration (pg/mL) of significant cytokines, chemokines, and growth factors among hepatitis C virus, hepatitis C virus-related liver cirrhosis patients, and healthy controls.
The mean concentrations, for each significant molecule, in healthy control subjects, HCV, and HCV-related LC patients were calculated using a t test. Healthy control - light grey; HCV patients - cyan, HCV-related LC patients - green bars. The cytokine expression was statistically different between HCV and HCV-related LC patients (aP < 0.05). HCV: Hepatitis C virus; LC: Liver cirrhosis; IL: Interleukin; NGF: Nerve growth factor; HGF: Hepatocyte growth factor; MIF: Migration inhibitory factor.
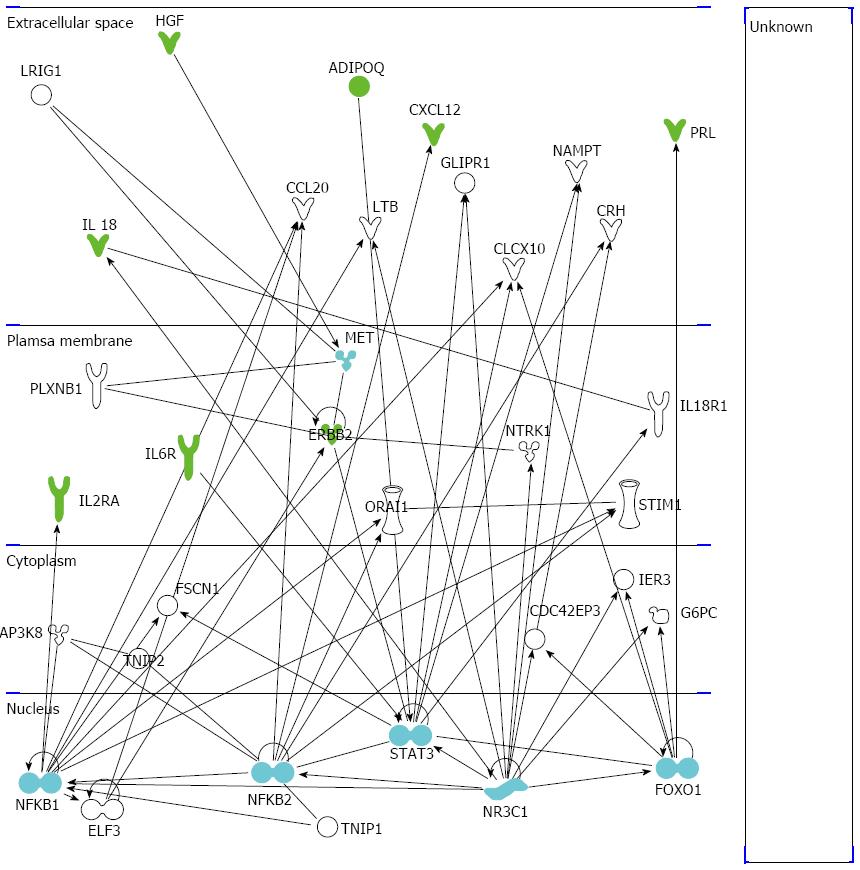
Figure 3 Ingenuity pathway analysis of the significant molecules.
The illustration shows the network of significant cytokines (green symbols), hub nodes (light blue symbols), and other involved molecules (white symbols) obtained by the ingenuity pathway analysis software. IL: Interleukin;HGF: Hepatocyte growth factor.
- Citation: Capone F, Guerriero E, Colonna G, Maio P, Mangia A, Castello G, Costantini S. Cytokinome profile evaluation in patients with hepatitis C virus infection. World J Gastroenterol 2014; 20(28): 9261-9269
- URL: https://www.wjgnet.com/1007-9327/full/v20/i28/9261.htm
- DOI: https://dx.doi.org/10.3748/wjg.v20.i28.9261


