Copyright
©2014 Baishideng Publishing Group Inc.
World J Gastroenterol. Jul 21, 2014; 20(27): 9128-9137
Published online Jul 21, 2014. doi: 10.3748/wjg.v20.i27.9128
Published online Jul 21, 2014. doi: 10.3748/wjg.v20.i27.9128
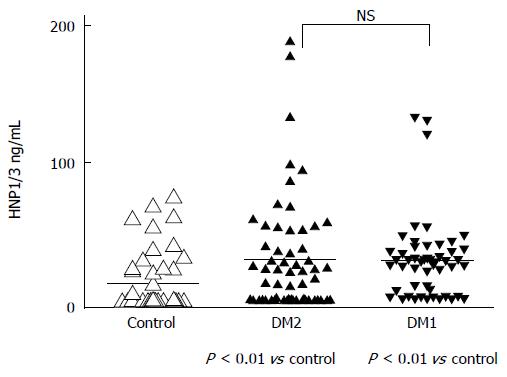
Figure 1 Plasma levels of HNP1-3 in patients with type 1 and type 2 diabetes (DM1 and DM2) and healthy controls.
The line represents the mean plasma levels of HNP1-3. Significant differences as determined by Mann-Whitney test are indicated. NS: Not significant.
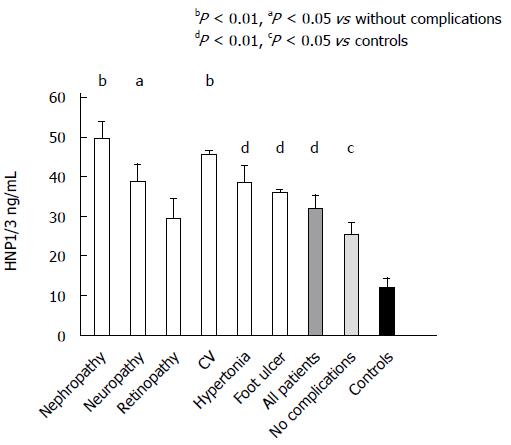
Figure 2 Plasma levels of human neutrophil peptides in diabetic patients with different complications relative to those without complications, and to healthy controls.
Mean ± SE are indicated; significant differences between groups were determined by unpaired t-test.
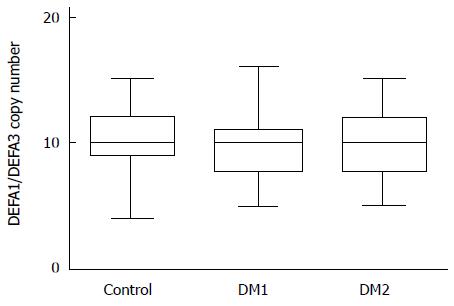
Figure 3 Genomic copy number of DEFA1/DEFA3 in patients with diabetes and in healthy blood donors.
Quantitative box-plot analysis (median, minimum, maximum value, 25% and 75% percentiles) of DEFA1/A3 copy numbers determined in DNA samples from 133 controls, 100 patients with type 1 diabetes (DM1), and 100 patients with type 2 diabetes (DM2).
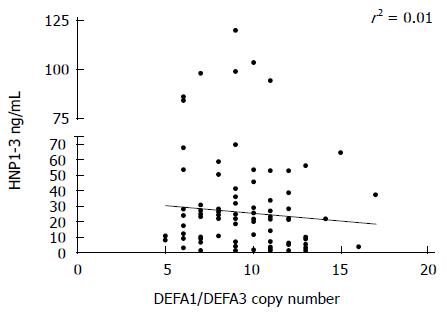
Figure 4 Plasma levels of HNP1-3 in diabetic patients vs copy numbers of DEFA1/DEFA3.
The DEFA1/A3 copy numbers were determined by quantitative PCR analysis and compared to the HNP1-3 plasma level of the same patient (50 with type 1 and 50 with type 2 diabetes).
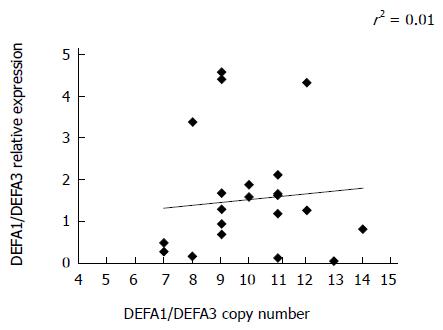
Figure 5 Relative mRNA expression levels of DEFA1/DEFA3 in diabetic patients vs copy numbers of DEFA1/DEFA3.
The DEFA1/A3 copy numbers were determined by quantitative PCR analysis and compared to the DEFA1/DEFA3 mRNA measured by RT-PCR of the same patient (12 with type 1 and 12 with type 2 diabetes).
- Citation: Németh BC, Várkonyi T, Somogyvári F, Lengyel C, Fehértemplomi K, Nyiraty S, Kempler P, Mándi Y. Relevance of α-defensins (HNP1-3) and defensin β-1 in diabetes. World J Gastroenterol 2014; 20(27): 9128-9137
- URL: https://www.wjgnet.com/1007-9327/full/v20/i27/9128.htm
- DOI: https://dx.doi.org/10.3748/wjg.v20.i27.9128


