Copyright
©2014 Baishideng Publishing Group Inc.
World J Gastroenterol. Jul 14, 2014; 20(26): 8558-8571
Published online Jul 14, 2014. doi: 10.3748/wjg.v20.i26.8558
Published online Jul 14, 2014. doi: 10.3748/wjg.v20.i26.8558
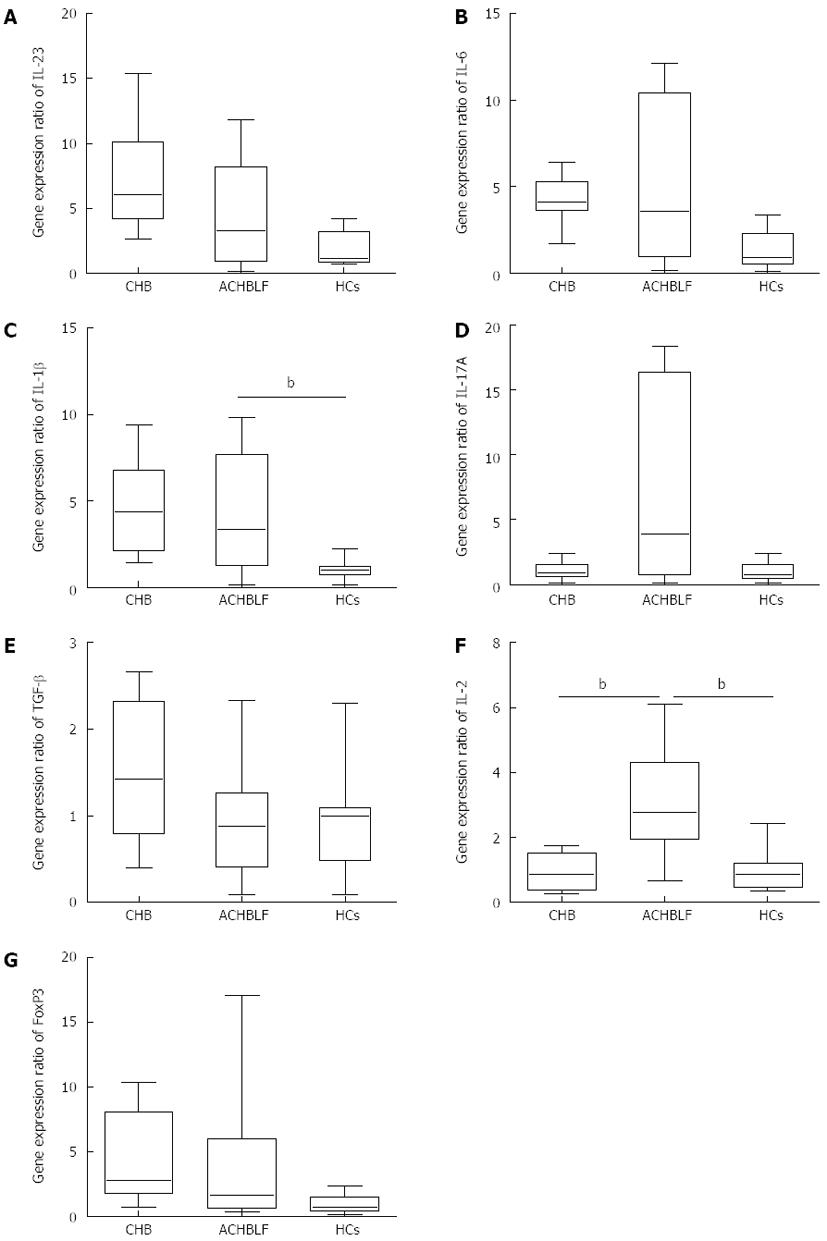
Figure 1 Expression of interleukin-17-producing T helper cell and Foxp3+ regulatory T cell-related genes in patients with hepatitis B virus-related acute-on-chronic liver failure at the onset point.
Compared with healthy controls (HCs), all interleukin-17-producing T helper cell (Th17)-related cytokines were up-regulated, but only IL-1β was up-regulated significantly. Compared with general chronic hepatitis B (CHB), there were no significant differences in Th17-related cytokine gene expression at the onset of hepatitis B virus-related acute-on-chronic liver failure (ACHBLF). For Foxp3+ regulatory T cell (Treg)-related gene expression, IL-2 expression was significantly up-regulated compared with both CHB patients and HCs. Data are presented as whisker-box plots, and the difference between ACHBLF and the HC or CHB groups was analyzed by a Mann-Whitney test. Boxes represent the interquartile range, with the median represented by the line inside the box. Upper whisker, the highest value less than or equal to the 75 percentile plus 1.5 times interquartile range; lower whisker, the lowest value greater than or equal to the 25 percentile minus 1.5 times interquartile range. Outliers were excluded. bP < 0.01 vs ACHBLF group.
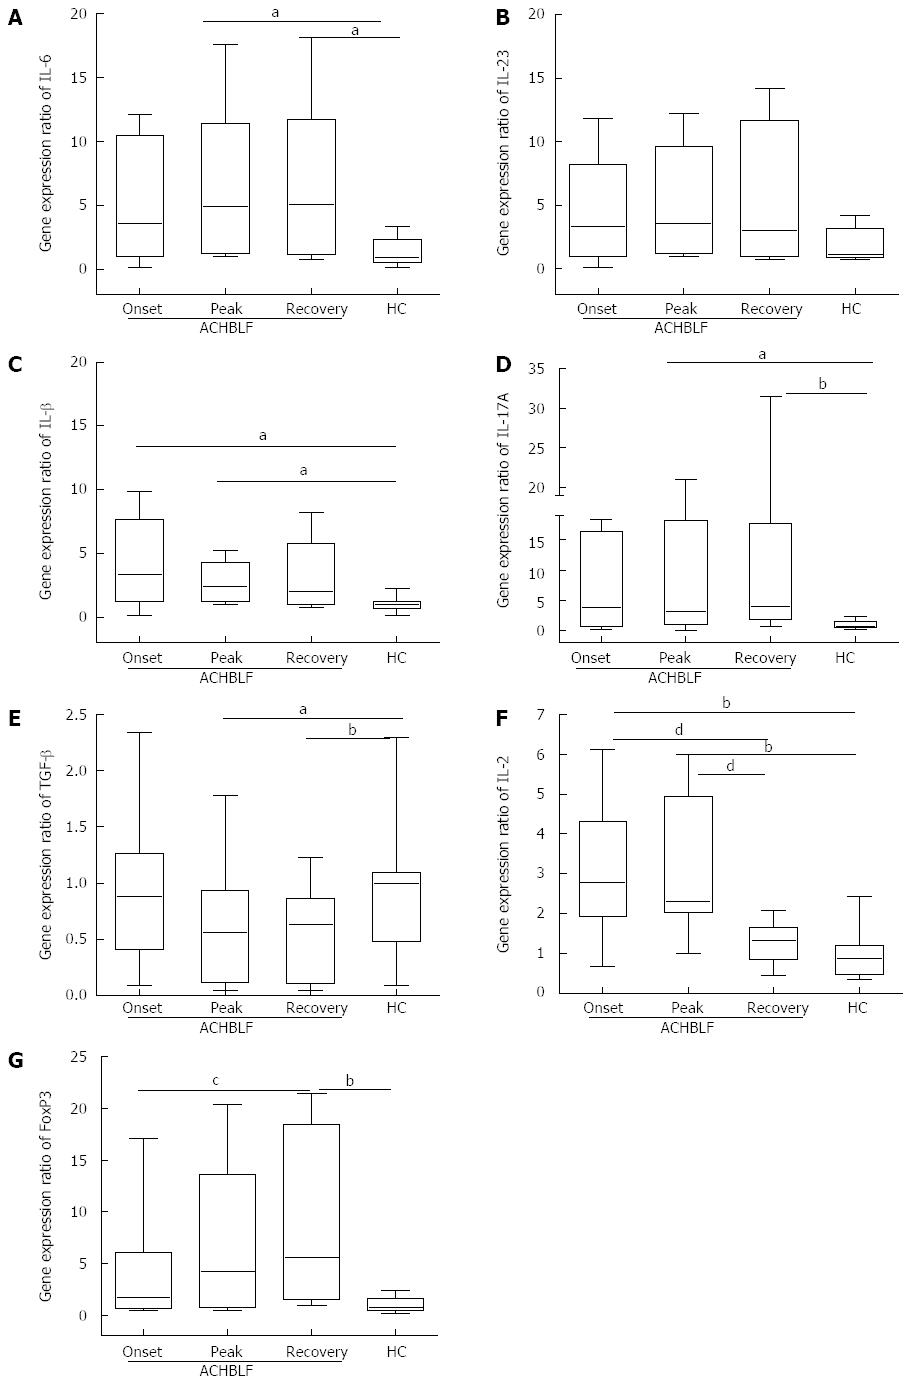
Figure 2 Dynamic cytokine milieu for interleukin-17-producing T helper cells and Foxp3+ regulatory T cells in patients with hepatitis B virus-related acute-on-chronic liver failure.
The gene expression of pro-th17 cytokines showed higher levels throughout the hepatitis B virus-related acute-on-chronic liver failure (ACHBLF) event compared with HCs, especially for IL-6 and IL-1β (A and C). FoxP3 gene expression was up-regulated gradually during ACHBLF events (G). Data are presented as whisker-box plots. Boxes represent the interquartile range, with the median represented by the line inside the box. Upper whisker, the highest value less than or equal to the 75 percentile plus 1.5 times interquartile range; lower whisker, the lowest value greater than or equal to the 25 percentile minus 1.5 times interquartile range. Outliers were excluded. Differences between different time points were analyzed by the Kruskal-Wallis test and with HCs by the Mann-Whitney test. aP < 0.05, bP < 0.01 vs HC; cP < 0.05, dP < 0.01 vs recovery group.
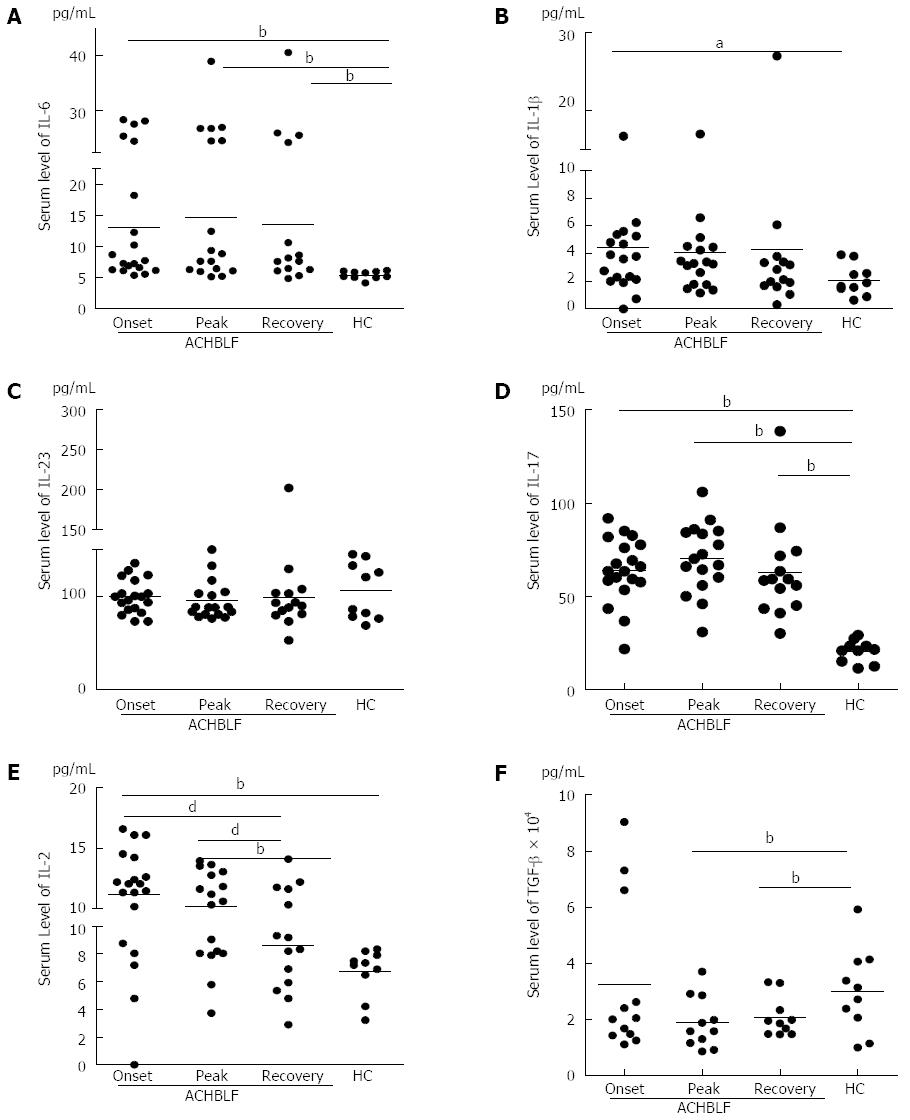
Figure 3 Serum levels of interleukin-17-producing T helper cell and Foxp3+ regulatory T cell-related cytokines in patients with hepatitis B virus-related acute-on-chronic liver failure.
A: Interleukin (IL)-6; B: IL-1β; C: IL-23; D: IL-17; E: IL-2; F: Transforming growth factor (TGF)-β1 were tested. Data are presented as the mean ± standard deviation. Differences between different time points were analyzed by the Kruskal-Wallis test and with HCs by the Mann-Whitney test. aP < 0.05; bP < 0.01 vs HC; dP < 0.01 vs recovery group.
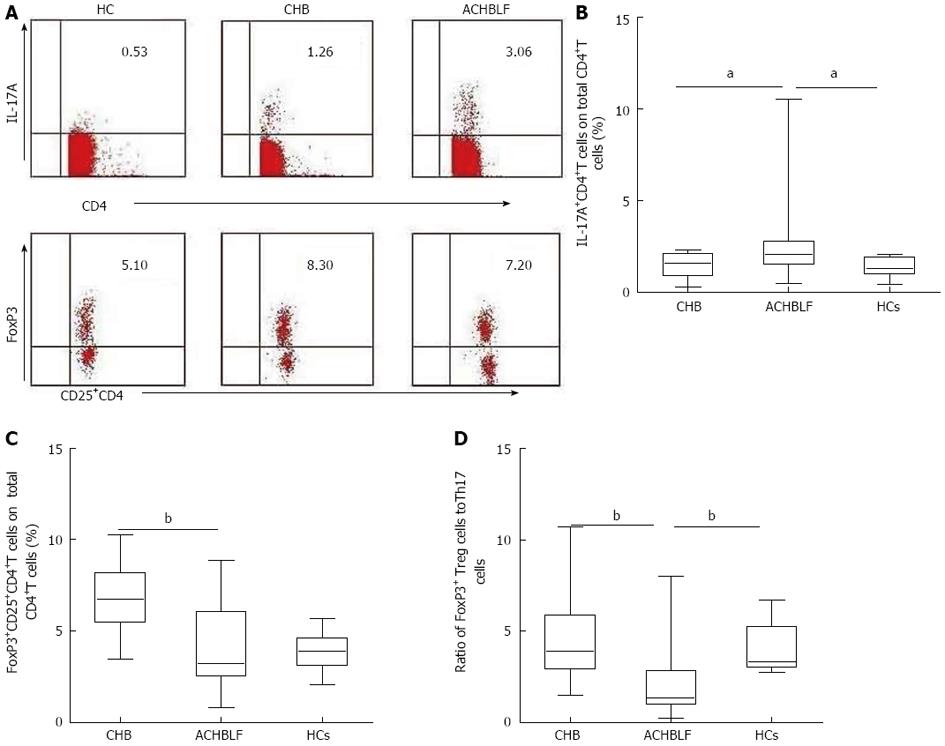
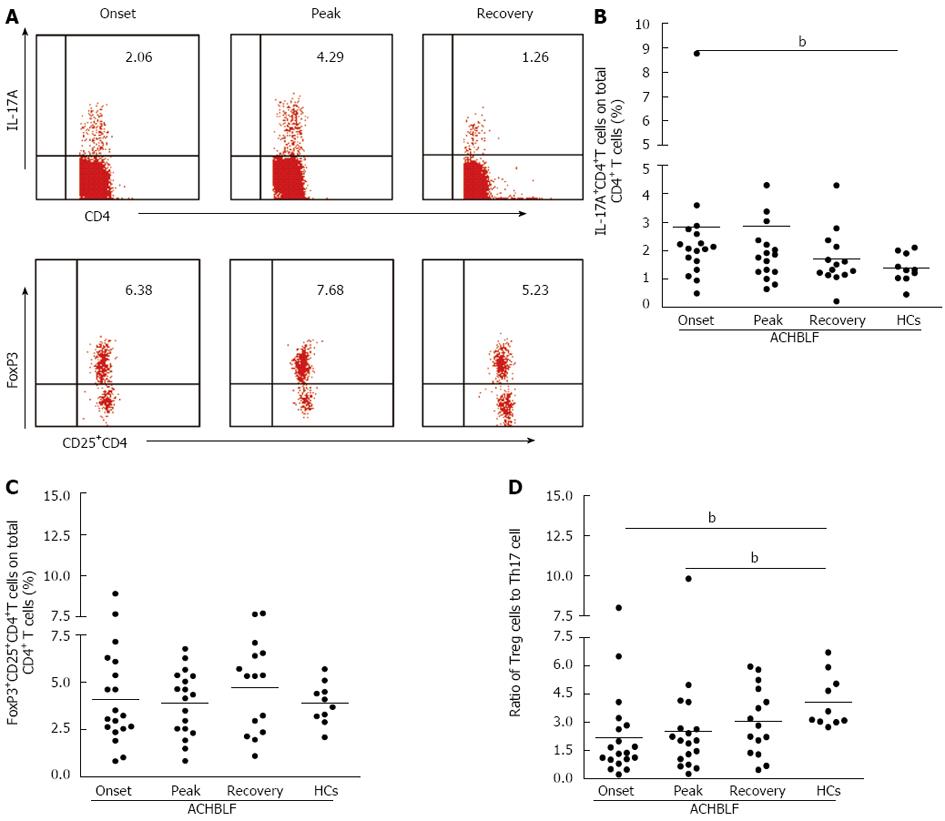
Figure 4 Population of interleukin-17-producing T helper cells as a percentage of total CD4+ cells in the peripheral blood mononuclear cells was evaluated by flow cytometry.
A: Representative dot plots of intracellular IL-17 and Foxp3 staining in patients with HBV-related acute-on-chronic liver failure (ACHBLF); B: Percentage of IL-17A+CD4+T cells in total CD4+T cells; C: Percentage of FoxP3+CD25+CD4+T cells in total CD4+T cells; D: Ratio of Treg cells to Th17 cells. CHB: Chronic hepatitis B. Differences between ACHBLF and HCs or CHB group were analyzed by the Mann-Whitney test. aP < 0.05, bP < 0.01 vs ACHBLF group.
Figure 5 Ratio of Foxp3+ regulatory T cells to interleukin-17-producing T helper cells was dynamically increased during hepatitis B virus-related acute-on-chronic liver failure.
A: Representative dot plots of intracellular IL-17 and Foxp3 staining in different stages of a hepatitis B virus-related acute-on-chronic liver failure (ACHBLF) individual. Values in the upper right quadrant indicate the circulating Th17 cells percentage and the FoxP3+ percentage of total CD4 T cells; B: The dynamics of Th17 cell frequency at the onset, peak and recovery phases of ACHBLF; C: The dynamics of Treg cells at the onset, peak and recovery phases of ACHBLF; D: The dynamics of the ratio of Treg to Th17 cell frequency at the onset, peak and recovery phases of acute-on-chronic HBV-related liver failure. The data were analyzed by one-way ANVOA Kruskal-Wallis test, P < 0.05 indicates significance. bP < 0.01 vs HCs.
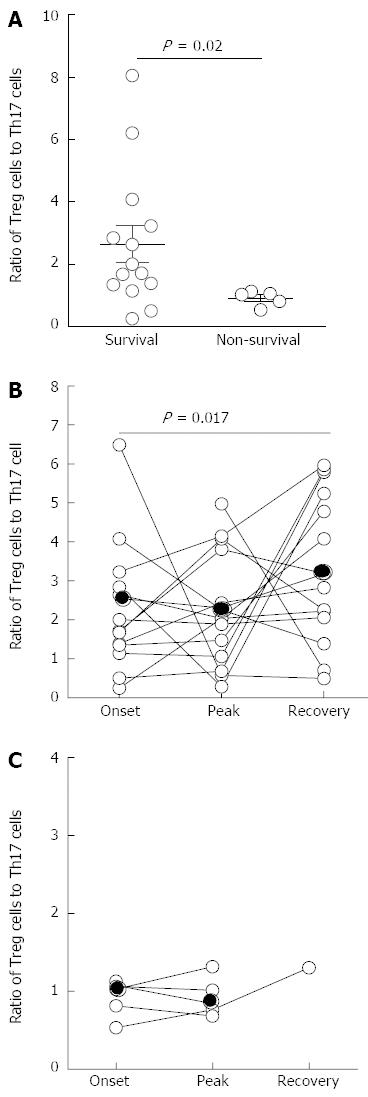
Figure 6 Predictive value of the Foxp3+ regulatory T cells to interleukin-17-producing T helper cells cell ratio during disease development on the survival of hepatitis B virus-related acute-on-chronic liver failure patients.
A: A lower ratio of Treg cells to Th17 frequency in non-survival ACHBLF patients at clinical onset; B: The distribution of the ratio of Treg cells to Th17 cells in surviving ACHBLF patients; C: The distribution of the ratio of Treg cells to Th17 cells in non-surviving ACHBLF patients. Each symbol represents one individual, and each line represents the changes in an individual patient’s ratio of Treg to Th17 frequency. The solid line depicts the mean ratio of all patients.
- Citation: Liang XS, Li CZ, Zhou Y, Yin W, Liu YY, Fan WH. Changes in circulating Foxp3+ regulatory T cells and interleukin-17-producing T helper cells during HBV-related acute-on-chronic liver failure. World J Gastroenterol 2014; 20(26): 8558-8571
- URL: https://www.wjgnet.com/1007-9327/full/v20/i26/8558.htm
- DOI: https://dx.doi.org/10.3748/wjg.v20.i26.8558


