Copyright
©2014 Baishideng Publishing Group Inc.
World J Gastroenterol. Jul 7, 2014; 20(25): 8260-8267
Published online Jul 7, 2014. doi: 10.3748/wjg.v20.i25.8260
Published online Jul 7, 2014. doi: 10.3748/wjg.v20.i25.8260
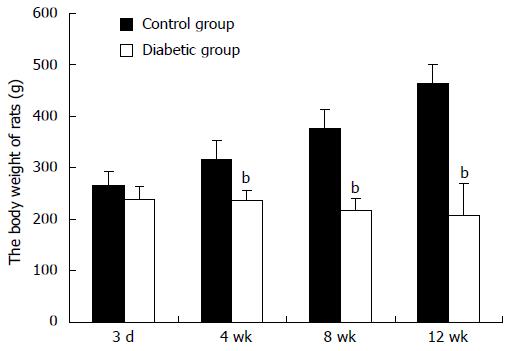
Figure 1 Body weight of each rat measured at the first, 4th, 8th and 12th week.
There was no difference in body weight between the diabetic group and control group during the first week. At the 4th wk, the body weight of diabetic rats significantly decreased compared with rats in the control group. bP < 0.01 vs the control group.
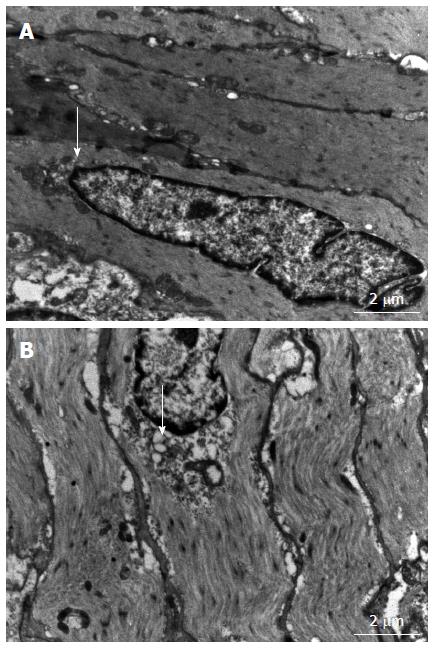
Figure 2 Gastric smooth muscle cells examined under a transmission electron microscope (TEM, original magnification × 10000).
A: Control group: No alterations in ER were observed (white arrow); B: Diabetic group: Swollen and distended endoplasmic reticulum with an irregular shape was observed in diabetic rats (white arrow).
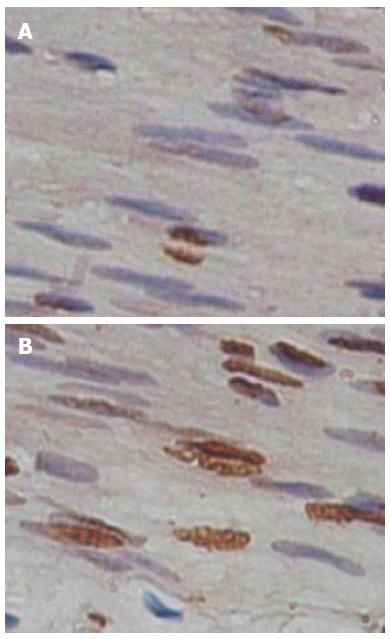
Figure 3 Apoptosis of gastric smooth muscle cells detected by TdT-mediated dUTP nick end labeling assay in diabetic and control rats.
A: Control group; B: Diabetic group. DAB staining, light microscopy, original magnification × 400.
Figure 4 Immunohistochemical staining of glucose-regulated protein 78 protein in gastric smooth muscle cells of diabetic and control rats.
A: Negative staining control. B: Control group. C: Diabetic group. DAB staining, light microscopy, original magnification × 200.
Figure 5 Immunohistochemical staining of caspase-12 protein in gastric smooth muscle cells of diabetic and control rats.
A: Negative staining control. B: Control group. C: Diabetic group. DAB staining, light microscopy, original magnification × 200.
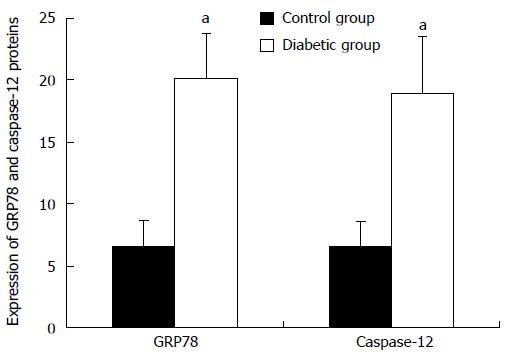
Figure 6 Comparison of the expression of glucose-regulated protein 78 and caspase-12 proteins in gastric smooth muscle cells between the diabetic and control groups.
Glucose-regulated protein 78 and caspase-12 protein expression was semiquantified by immunohistochemistry as shown in the Methods section. Results are expressed as mean ± SE. aP < 0.05 vs the control group.
- Citation: Chen X, Fu XS, Li CP, Zhao HX. ER stress and ER stress-induced apoptosis are activated in gastric SMCs in diabetic rats. World J Gastroenterol 2014; 20(25): 8260-8267
- URL: https://www.wjgnet.com/1007-9327/full/v20/i25/8260.htm
- DOI: https://dx.doi.org/10.3748/wjg.v20.i25.8260


