Copyright
©2014 Baishideng Publishing Group Inc.
World J Gastroenterol. Jun 14, 2014; 20(22): 6844-6859
Published online Jun 14, 2014. doi: 10.3748/wjg.v20.i22.6844
Published online Jun 14, 2014. doi: 10.3748/wjg.v20.i22.6844
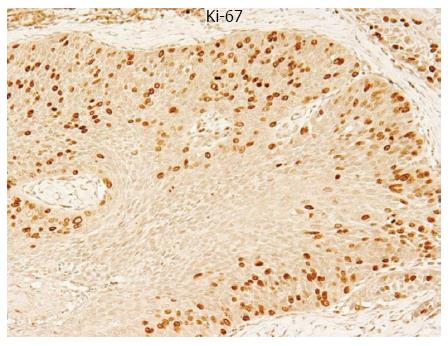
Figure 1 Immunohistochemical staining of a primary tumor sample of human esophageal squamous cell carcinomas with a Ki-67 antibody.
The expression of Ki-67 was clearly identified in the nucleus of ESCCs (Magnification × 200).
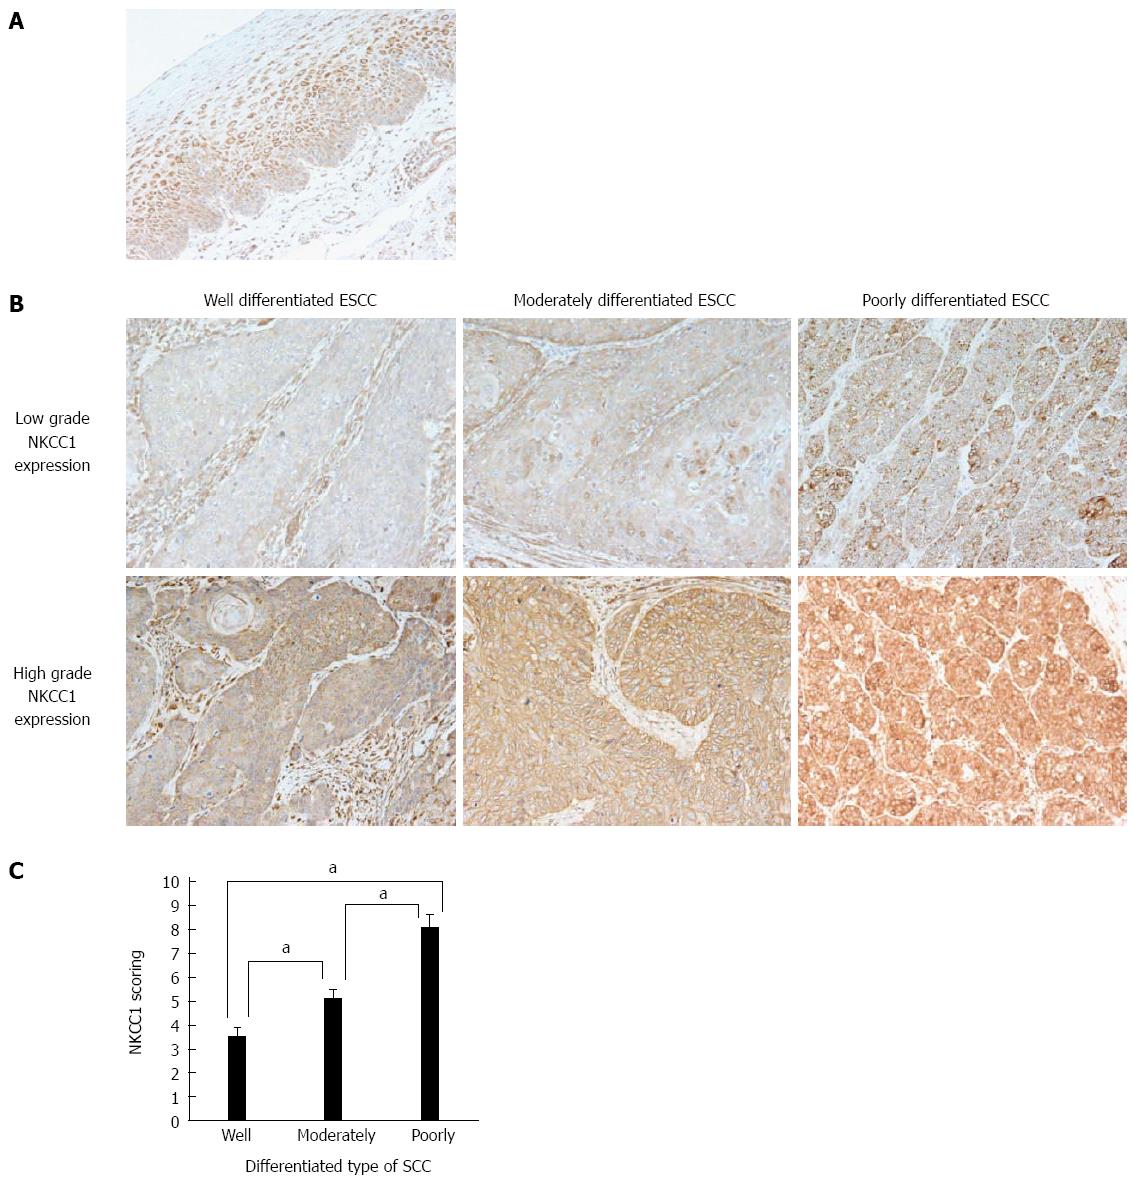
Figure 2 Na+/K+/2Cl- cotransporter 1 protein expression in human esophageal squamous cell carcinomas.
A: Immunohistochemical staining of human esophageal epithelia with an Na+/K+/2Cl- cotransporter 1 (NKCC1) antibody. Cells with NKCC1 expression were primarily confined to the lower and middle layers of the squamous epithelium with the exception of the basal and parabasal cell layers; B: Immunohistochemical staining of well differentiated, moderately differentiated, or poorly differentiated esophageal squamous cell carcinoma (ESCC) tumor samples with high or low grade NKCC1 expression (magnification: × 200); C: NKCC1 staining scores according to the differentiation type of SCC. Mean ± SEM. Well differentiated ESCC; n = 15. Moderately differentiated ESCC; n = 31. Poorly differentiated ESCC; n = 22. aP < 0.05 vs control, Tukey-Kramer HSD test.
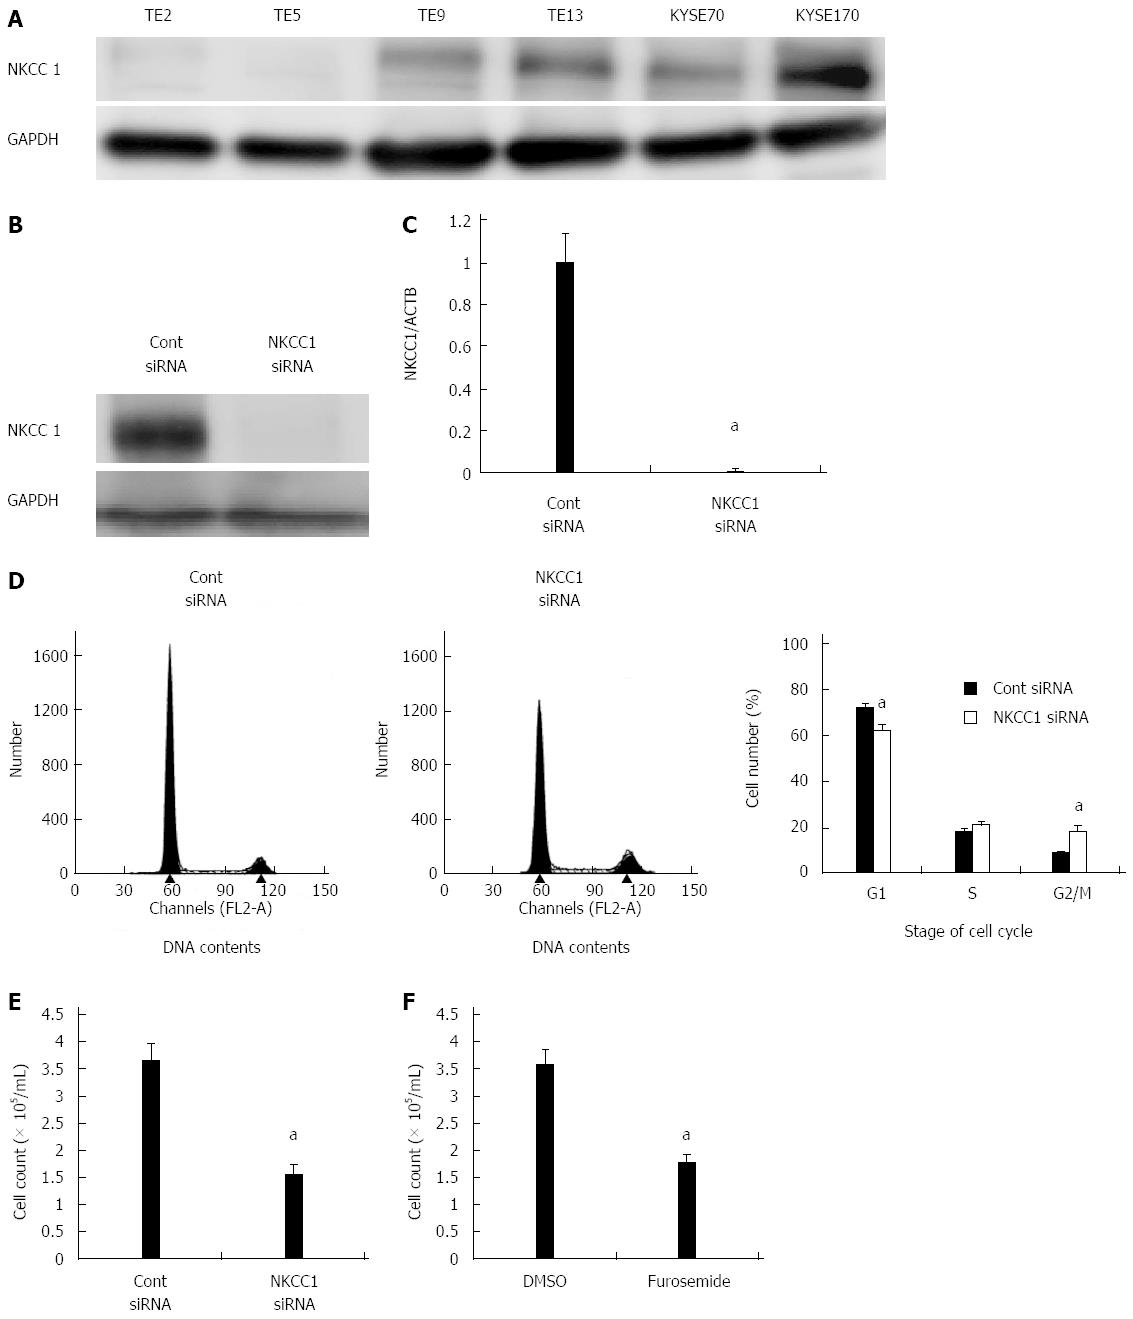
Figure 3 Na+/K+/2Cl- cotransporter 1 controls cell cycle progression in esophageal squamous cell carcinoma cells.
A: Na+/K+/2Cl- cotransporter 1 (NKCC1) protein expression was analyzed in 6 esophageal squamous cell carcinoma (ESCC) cell lines. Western blotting revealed that NKCC1 was highly expressed in the KYSE170 cell line, and lower levels of expression were observed in TE2 and TE5 cells. B: Western blotting revealed that NKCC1 small interfering RNA (siRNA) effectively reduced the protein levels of NKCC1 in KYSE170 cells; C: NKCC1 siRNA effectively reduced the mRNA levels of NKCC1 in KYSE170 cells. The mean ± SEM. n = 4. aP < 0.05 vs the control siRNA group; D: The depletion of NKCC1 induced G2/M phase arrest in KYSE170 cells. Cells transfected with control or NKCC1 siRNA were stained with propidium iodide (PI) and analyzed by flow cytometry. The mean ± SEM. n = 5. aP < 0.05 vs control siRNA; E: The depletion of NKCC1 inhibited the proliferation of KYSE170 cells. Cell number was counted 72 h after siRNA transfection. The mean ± SEM. n = 5. aP < 0.05 (significantly different from control siRNA); F: The NKCC blocker furosemide inhibited the proliferation of KYSE170 cells. Cell number was counted 72 h after drug stimulation (500 μmol/L furosemide). The mean ± SEM. n = 5. aP < 0.05 vs control (significantly different from 500 μmol/L DMSO). GAPDH: Glyceraldehyde-3-phosphate dehydrogenase.
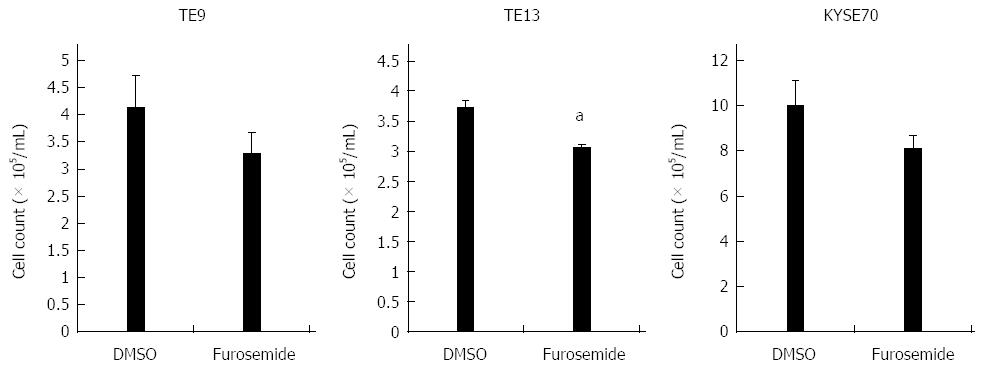
Figure 4 Effects of the Na+/K+/2Cl- cotransporter blocker furosemide on the proliferation of TE9, TE13 and KYSE70 cells.
Cell number was counted 72 h after drug stimulation (500 μmol/L furosemide). The mean ± SEM. n = 3. aP < 0.05 vs control (significantly different from 500 μmol/L DMSO).
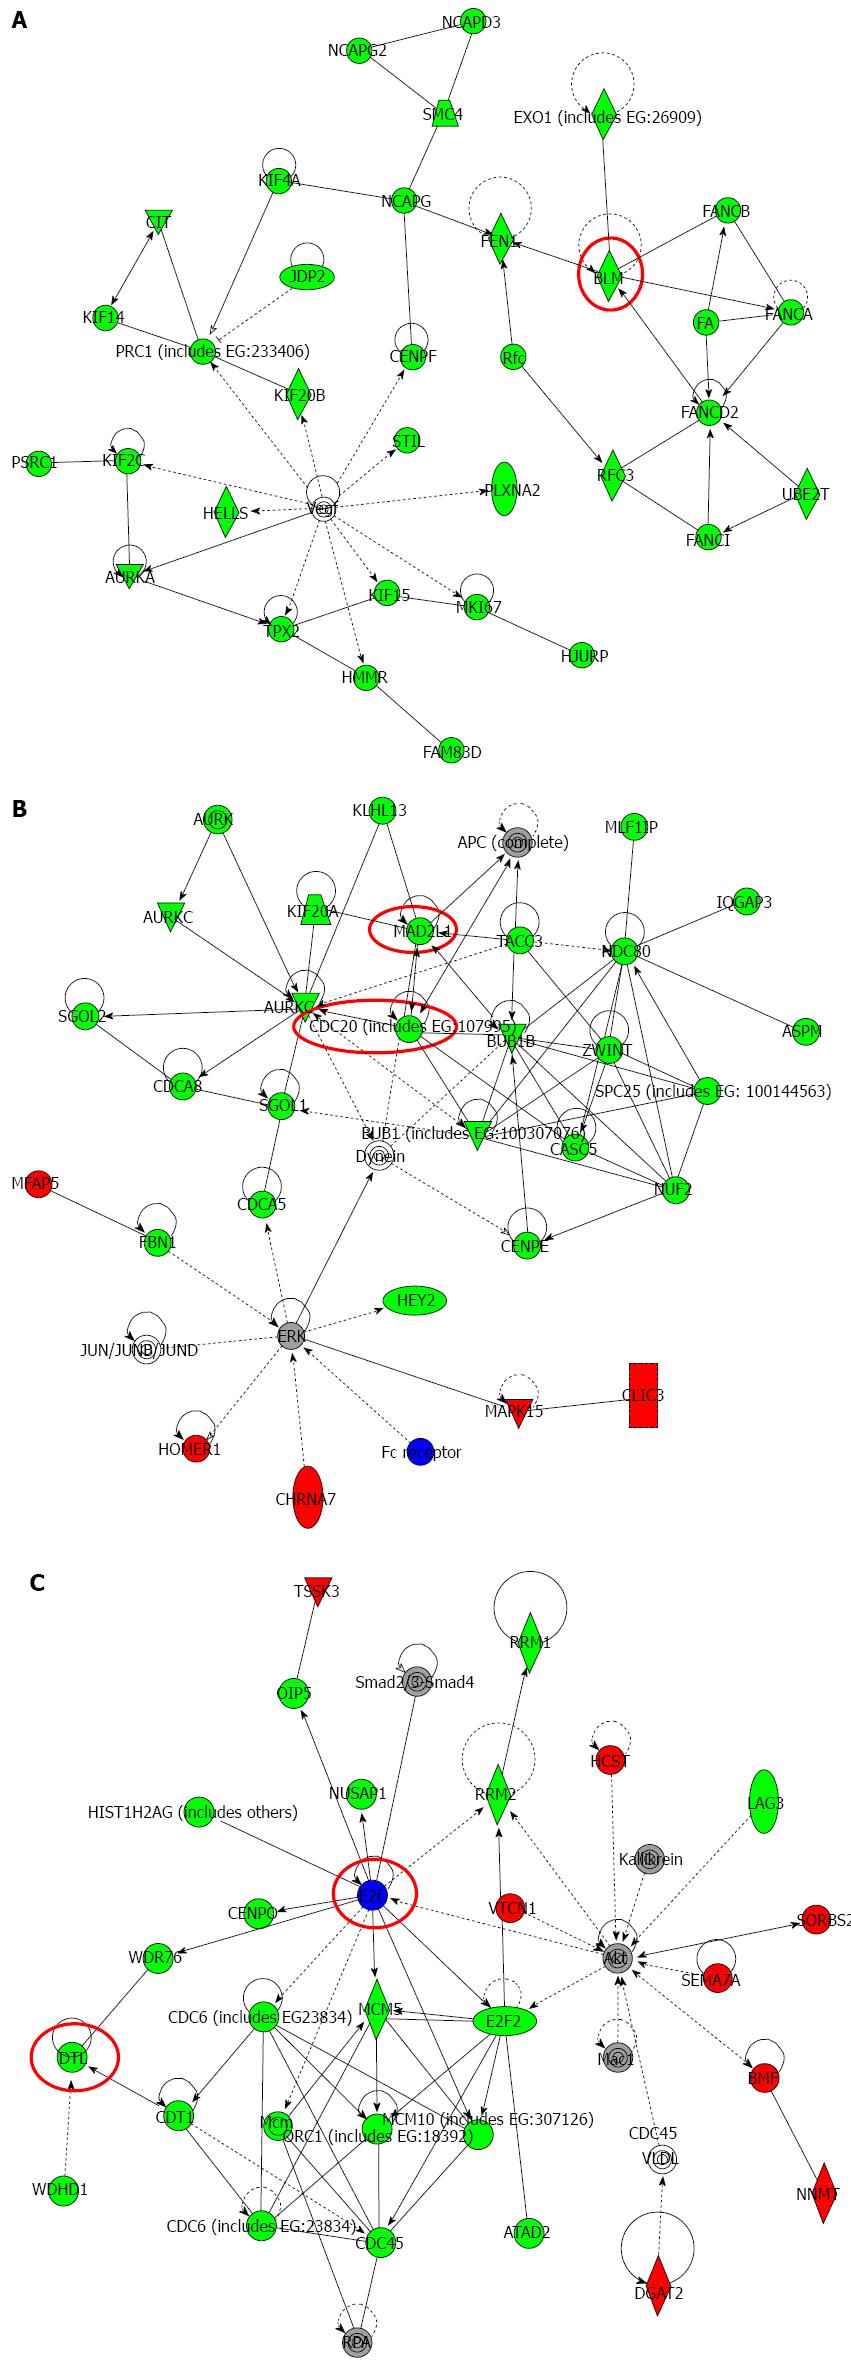
Figure 5 Top-ranked signaling networks related to Na+/K+/2Cl- cotransporter 1 downregulation according to ingenuity pathway analysis.
A: This network is called “Cellular Assembly and Organization; DNA Replication, Recombination, and Repair; Cell Cycle”; B: This network is called “Cellular Assembly and Organization, Cell Cycle, DNA Replication, Recombination, and Repair”; C: This network is called “Cell Cycle; DNA Replication, Recombination, and Repair; Cancer”. Red and green indicate genes with expression levels that were higher or lower, respectively, than reference RNA levels. Genes analyzed for verification in Figure 6 were highlighted by red circles.
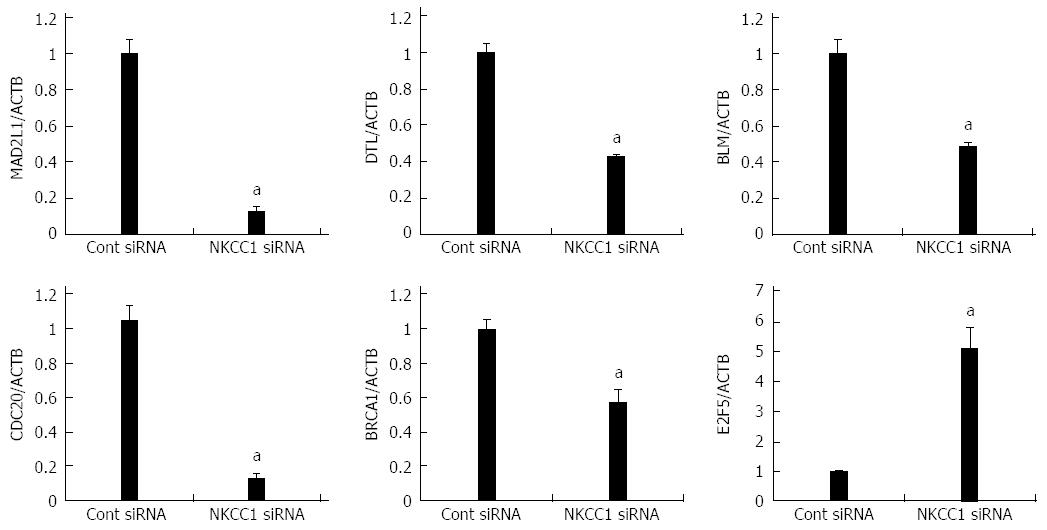
Figure 6 Verification of gene expression by real-time quantitative reverse transcription-polymerase chain reaction.
The expression levels of six selected genes (MAD2L1, DTL, BLM, CDC20, BRCA1, and E2F5) in NKCC1 depleted KYSE170 cells were compared to those in control siRNA transfected cells using real-time quantitative reverse transcription-polymerase chain reaction. Gene expression levels were normalized to the level of ACTB. The mean ± SEM. n = 3. aP < 0.05 vs control siRNA.
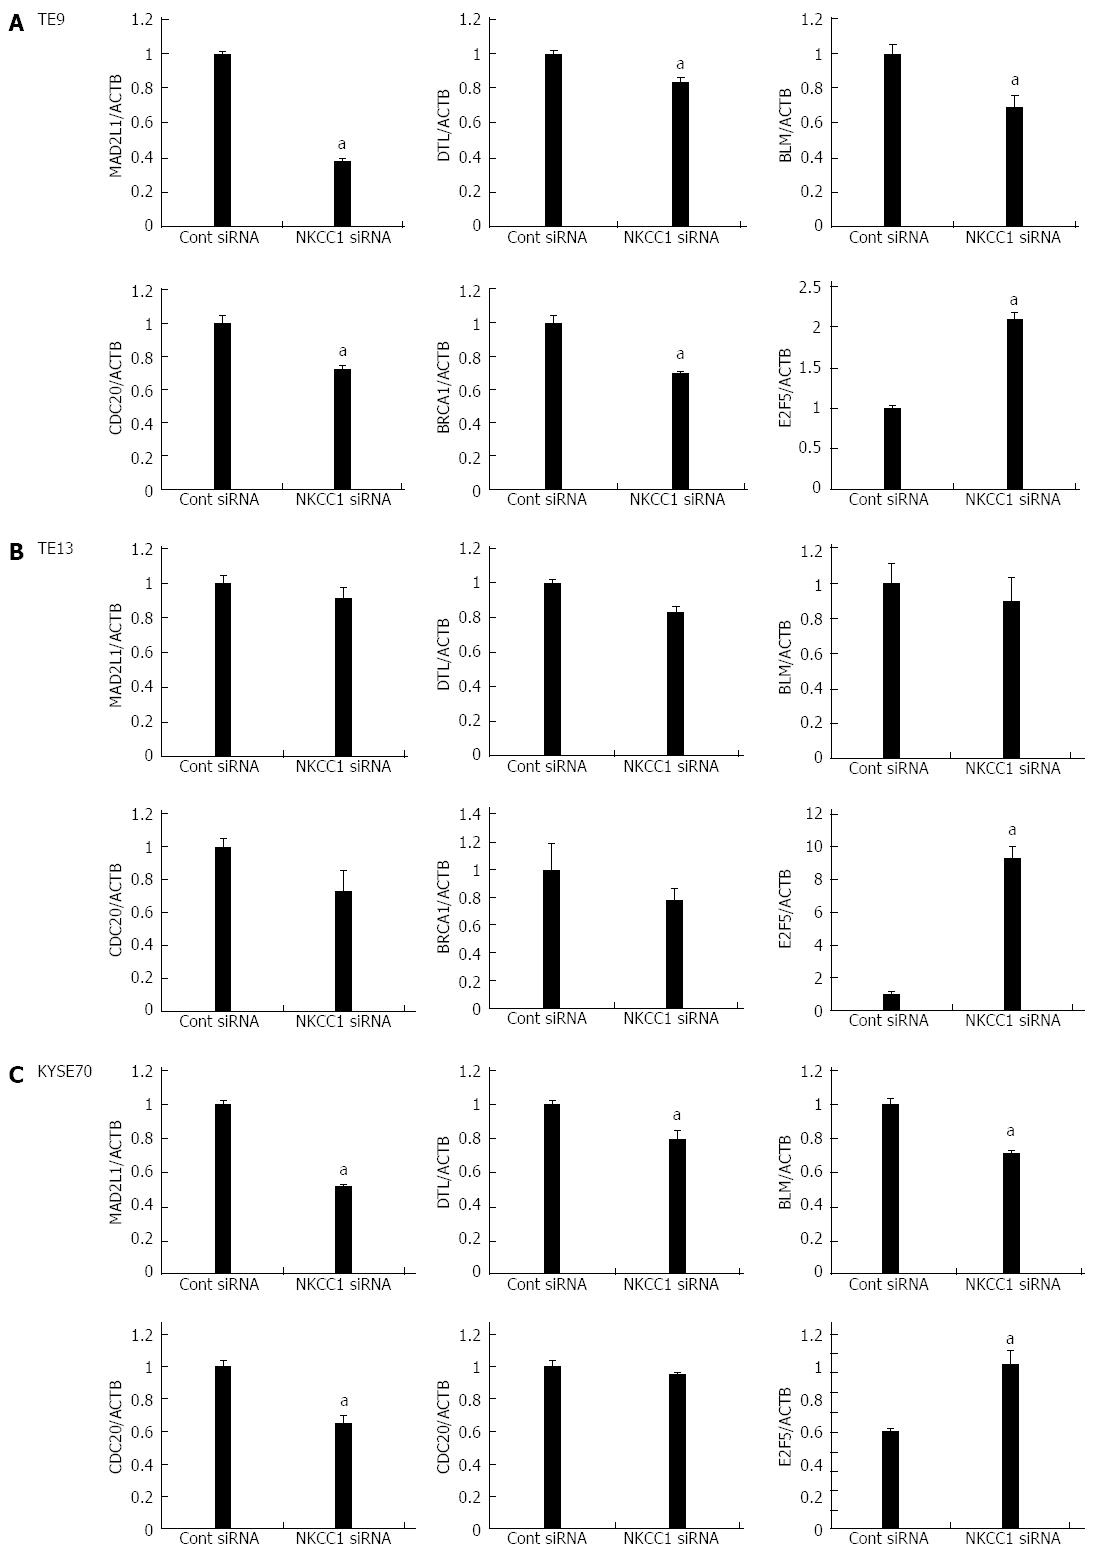
Figure 7 Expression levels of six selected genes (MAD2L1, DTL, BLM, CDC20, BRCA1, and E2F5) in Na+/K+/2Cl- cotransporter 1 depleted TE9, TE13 and KYSE70 cells.
The expression levels of six selected genes (MAD2L1, DTL, BLM, CDC20, BRCA1, and E2F5) in Na+/K+/2Cl- cotransporter 1 (NKCC1) depleted TE9 (A), TE13 (B) and KYSE70 cells (C) were compared to those in control siRNA transfected cells using real-time quantitative RT-PCR. Gene expression levels were normalized to the level of ACTB. The mean ± SEM. n = 3. aP < 0.05 vs control siRNA.
- Citation: Shiozaki A, Nako Y, Ichikawa D, Konishi H, Komatsu S, Kubota T, Fujiwara H, Okamoto K, Kishimoto M, Marunaka Y, Otsuji E. Role of the Na+/K+/2Cl- cotransporter NKCC1 in cell cycle progression in human esophageal squamous cell carcinoma. World J Gastroenterol 2014; 20(22): 6844-6859
- URL: https://www.wjgnet.com/1007-9327/full/v20/i22/6844.htm
- DOI: https://dx.doi.org/10.3748/wjg.v20.i22.6844


