Copyright
©2014 Baishideng Publishing Group Co.
World J Gastroenterol. Jan 14, 2014; 20(2): 363-375
Published online Jan 14, 2014. doi: 10.3748/wjg.v20.i2.363
Published online Jan 14, 2014. doi: 10.3748/wjg.v20.i2.363
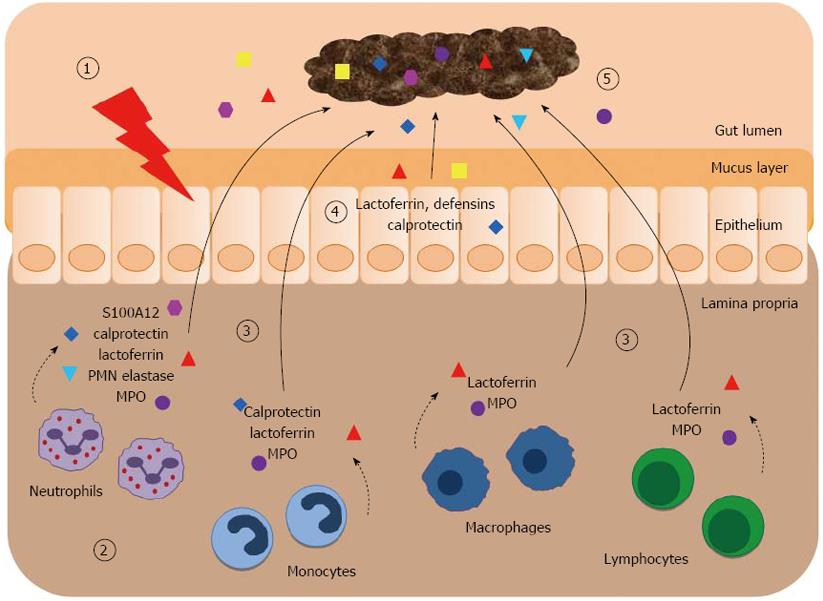
Figure 1 Faecal markers of intestinal inflammation.
(1) Initially, unidentified triggers affect the epithelium and lead to an activation of the intestinal immune system; (2) The initiated immune response involves the influx of different innate immune cells (e.g., granulocytes, monocytes, macrophages) and cells of the adaptive immune system (e.g., T cells) into the affected mucosa. These cells actively secret inflammatory mediators or release granule proteins by cell degranulation. The contents of neutrophil granules [ lactoferrin, polymorphonuclear (PMN) elastase, myeloperoxidase (MPO)] have antimicrobial properties. The cytosol is the source of the damage associated molecular pattern proteins S100A8/A9 ( calprotectin) and S100A12 (); (3) During early stages of intestinal inflammation these released proteins spill over from the mucosa into the gut lumen; (4) Some of these factors (including defensins) are also released from the epithelium and the mucus layer; (5) In direct contact with the intestinal mucosa, the faecal stream contains the specific proteins of mucosal disease. The detection of these markers in faeces indicates the presence and degree of intestinal inflammation.
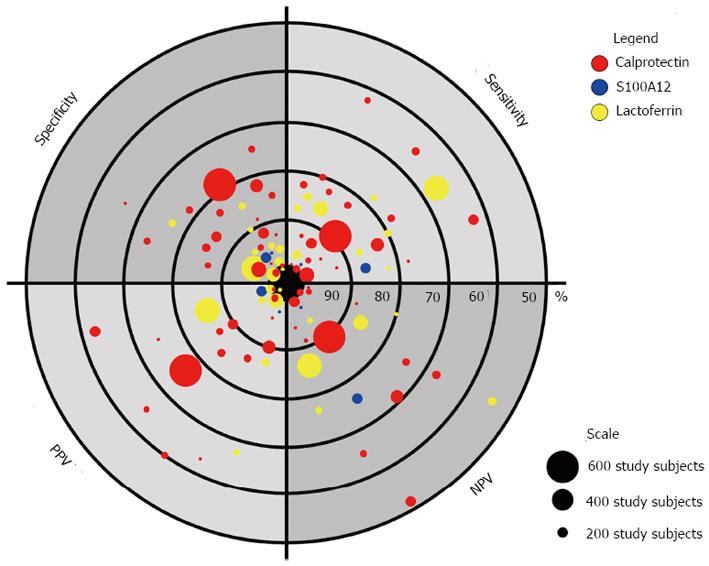
Figure 2 Diagnostic accuracy of faecal markers in the differentiation of organic gastrointestinal disease vs irritable bowel syndrome.
The figure illustrates statistical measures of the diagnostic performance of different studies on the role of faecal markers in the diagnosis of irritable bowel syndrome. Sensitivities, specificities, positive predictive values (PPV), and negative predictive values (NPV) of different biomarker studies are represented with highest values close to the center of the “dartboard” (i.e., 100%). Each dot represents a biomarker study and different colors represent the type of the faecal marker (see legend). The size of each dot represents the number of included study subjects (see scale).
- Citation: Däbritz J, Musci J, Foell D. Diagnostic utility of faecal biomarkers in patients with irritable bowel syndrome. World J Gastroenterol 2014; 20(2): 363-375
- URL: https://www.wjgnet.com/1007-9327/full/v20/i2/363.htm
- DOI: https://dx.doi.org/10.3748/wjg.v20.i2.363


