Copyright
©2014 Baishideng Publishing Group Co.
World J Gastroenterol. Jan 14, 2014; 20(2): 363-375
Published online Jan 14, 2014. doi: 10.3748/wjg.v20.i2.363
Published online Jan 14, 2014. doi: 10.3748/wjg.v20.i2.363
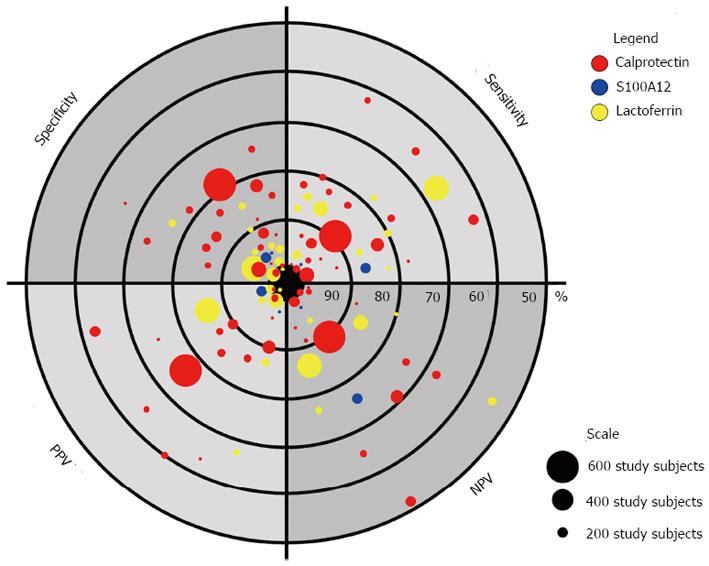
Figure 2 Diagnostic accuracy of faecal markers in the differentiation of organic gastrointestinal disease vs irritable bowel syndrome.
The figure illustrates statistical measures of the diagnostic performance of different studies on the role of faecal markers in the diagnosis of irritable bowel syndrome. Sensitivities, specificities, positive predictive values (PPV), and negative predictive values (NPV) of different biomarker studies are represented with highest values close to the center of the “dartboard” (i.e., 100%). Each dot represents a biomarker study and different colors represent the type of the faecal marker (see legend). The size of each dot represents the number of included study subjects (see scale).
- Citation: Däbritz J, Musci J, Foell D. Diagnostic utility of faecal biomarkers in patients with irritable bowel syndrome. World J Gastroenterol 2014; 20(2): 363-375
- URL: https://www.wjgnet.com/1007-9327/full/v20/i2/363.htm
- DOI: https://dx.doi.org/10.3748/wjg.v20.i2.363


