Copyright
©2014 Baishideng Publishing Group Co.
World J Gastroenterol. May 14, 2014; 20(18): 5527-5532
Published online May 14, 2014. doi: 10.3748/wjg.v20.i18.5527
Published online May 14, 2014. doi: 10.3748/wjg.v20.i18.5527
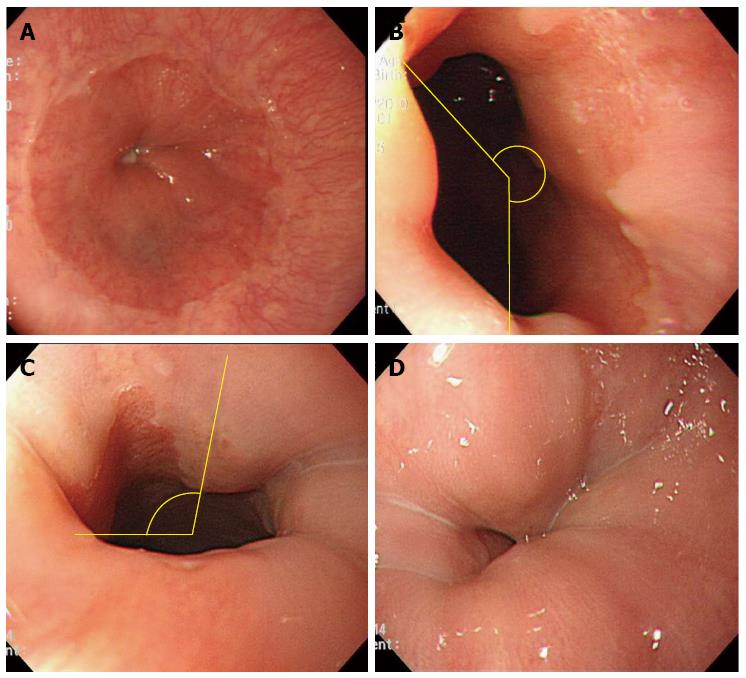
Figure 1 Esophagogastric junction territory observed during esophagogastroduodenoscopy.
A: Excellent, 100% view of Z-line; B: Good, 100% > Z-line ≥ 50%; C: Fair, 50% > Z-line; D: Poor, Z-line not visualized. Yellow lines indicate the observation territory.
- Citation: Kim ES, Lee HY, Lee YJ, Min BR, Choi JH, Park KS, Cho KB, Jang BK, Chung WJ, Hwang JS. Negative impact of sedation on esophagogastric junction evaluation during esophagogastroduodenoscopy. World J Gastroenterol 2014; 20(18): 5527-5532
- URL: https://www.wjgnet.com/1007-9327/full/v20/i18/5527.htm
- DOI: https://dx.doi.org/10.3748/wjg.v20.i18.5527


