Copyright
©2014 Baishideng Publishing Group Co.
World J Gastroenterol. May 14, 2014; 20(18): 5493-5504
Published online May 14, 2014. doi: 10.3748/wjg.v20.i18.5493
Published online May 14, 2014. doi: 10.3748/wjg.v20.i18.5493
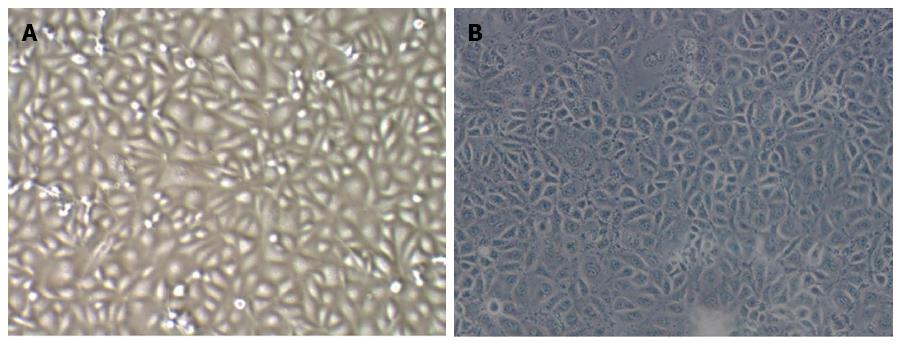
Figure 1 Comparison of the morphology of Tumor endothelial cells and Hepatic sinusoidal endothelial cells.
TECs had different sizes, irregular morphology, and a scattered distribution. HSECs had a uniform morphology and showed a clustered distribution. (A: TEC 100 ×; B: HSEC 100 ×). TEC: Tumor endothelial cell; HSEC: Hepatic sinusoidal endothelial cell.
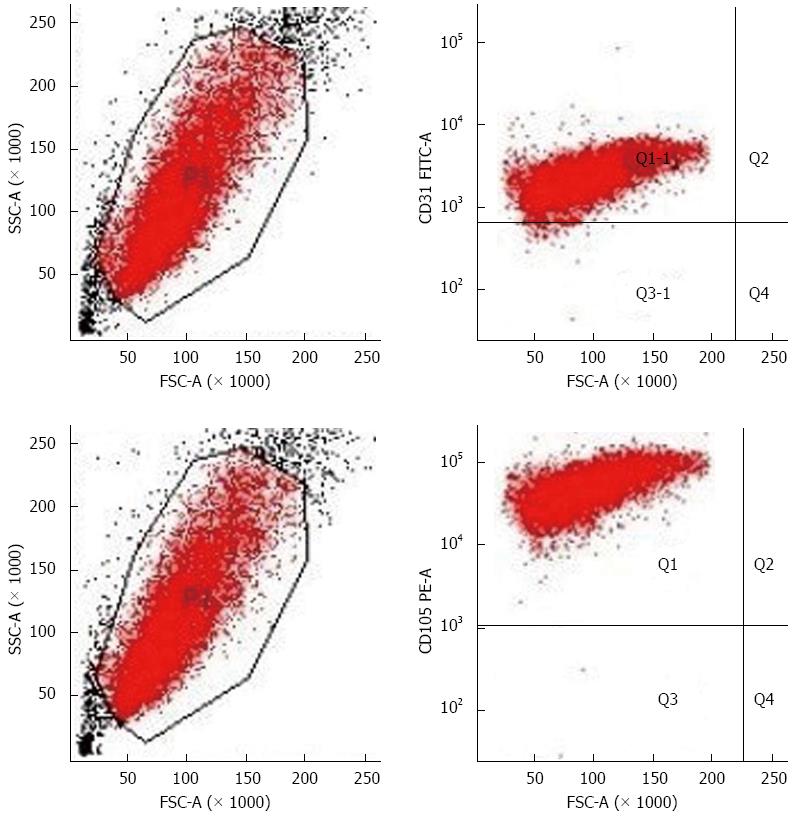
Figure 2 Flow cytometry results.
The positive rates of CD105 and CD31 expression were 100% and 98.7%, respectively, which excluded the possibility of hepatoma cell, macrophage, and fibroblast contamination.
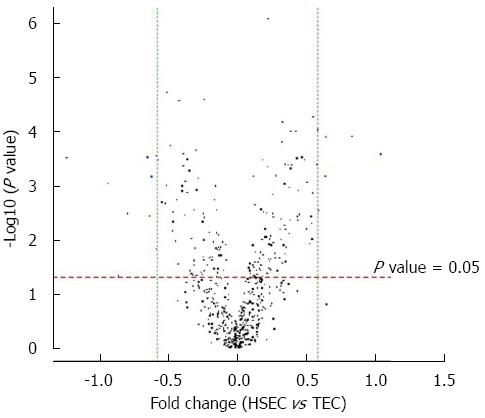
Figure 3 Volcano plot of sample hepatic sinusoidal endothelial cells vs tumor endothelial cells.
Standard selection criteria to identify differentially expressed genes are established at |Fold change| ≥ 0.585 and P value < 0.05 (Blue dot in figure). TEC: Tumor endothelial cell; HSEC: Hepatic sinusoidal endothelial cell.
Figure 4 Clustering analysis.
Clustering was performed to visualize the correlations among the replicates and varying sample conditions. Up- and down-regulated genes are represented in red and green colors, respectively. TEC: Tumor endothelial cell; HSEC: Hepatic sinusoidal endothelial cell.
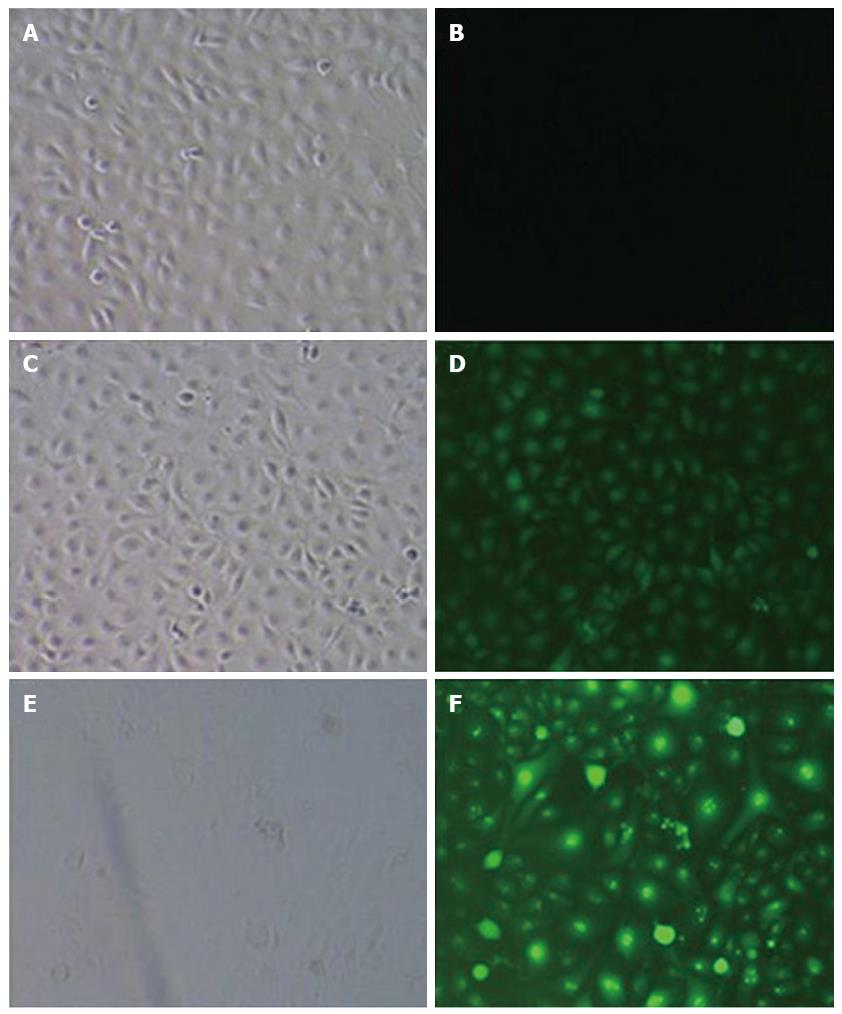
Figure 5 Determination of lentivirus titers after infection of tumor endothelial cells.
GFP expression 3 d after infection. B and G indicate the bright field and the green fluorescence field, respectively (A: CON 100 × B; B: CON 100 × G; C: NC 100 × B; D: NC 100 × G; E: Micro-up 100 × B; F: Micro-up 100 × G). The micro-up group achieved relatively ideal transduction efficiency. The percentage of cells with positive fluorescence was over 90%.
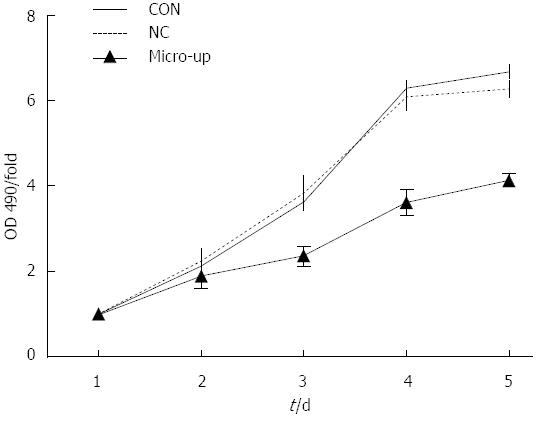
Figure 6 Detection of tumor endothelial cell proliferation before and after transduction.
Five days of continuous observation of each group’s OD values demonstrated that the proliferation of these groups started to show significant differences from day 3; cell proliferation in the micro-up group (2.36 ± 0.23) was significantly lower than that in the CON group (3.65 ± 0.17) and the NC group (3.83 ± 0.39), and the proliferation inhibition rate in the micro-up group (3.61 ± 0.29) presented the largest difference on day 4, as compared to the other two groups (P < 0.01).
Figure 7 Apoptosis of the three groups of cells.
There were no significant differences between the CON group (1.54% ± 0.11%) and the NC group (1.61% ± 0.25%), while the micro-up group (4.09% ± 0.16%) showed significant apoptosis compared to the other groups (P < 0.01). Over-expression of transduced miR-204-3p significantly promoted apoptosis in tumor endothelial cells.
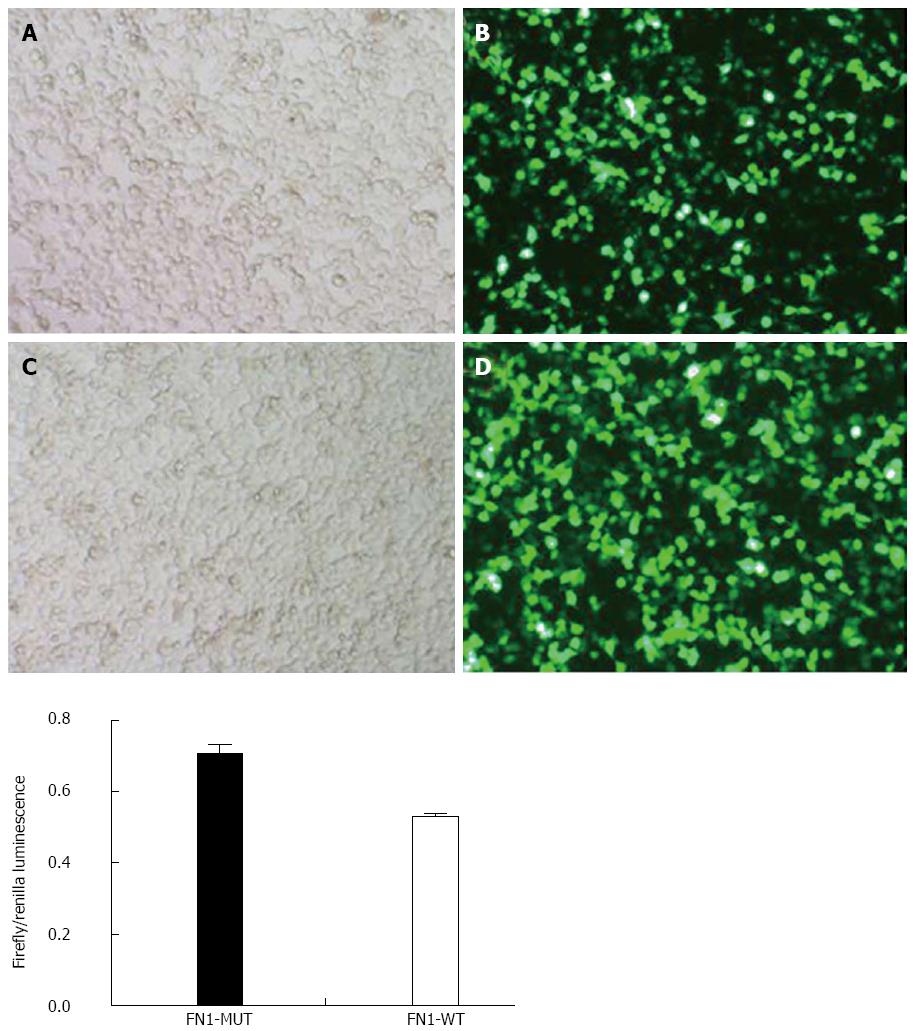
Figure 8 Identification of fibronectin 1 as a target gene of miR-204-3p.
Comparison of the firefly luciferase activities (i.e., the GFP expression level) of the two groups of cells 24 h after transfection showed that the luciferase activity in the wild type fibronectin 1 (FN1-WT) group was significantly inhibited. The luciferase activity in the FN1-WT group (0.52 ± 0.01) was significantly lower than that in the FN1-MUT group (0.71 ± 0.02) (P < 0.05). A: FN1-WT 100 × B; B: FN1-WT 100 × G; C: FN1-MUT 100 × B; D: FN1-MUT 100 × G.
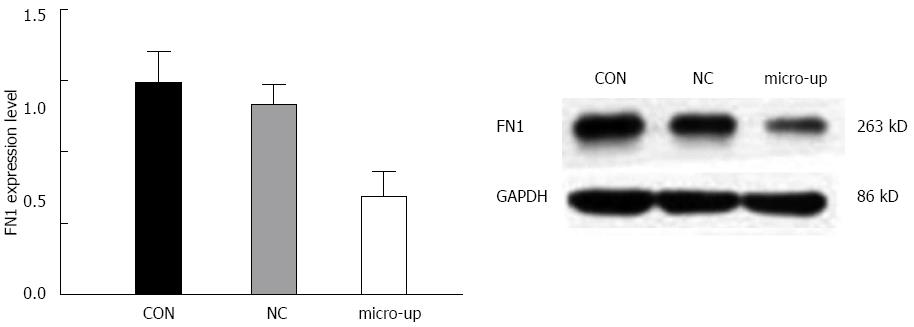
Figure 9 Silencing effect of miR-204-3p on the expression of fibronectin 1 in tumor endothelial cells.
Western blot analysis showed that after over-expression of miR-204-3p, the fibronectin 1 (FN1) protein expression level in tumor endothelial cells was significantly lower than those in the CON and NC groups, which verified the silencing effect of miR-204-3p on the FN1 gene.
- Citation: Cui ZH, Shen SQ, Chen ZB, Hu C. Growth inhibition of hepatocellular carcinoma tumor endothelial cells by miR-204-3p and underlying mechanism. World J Gastroenterol 2014; 20(18): 5493-5504
- URL: https://www.wjgnet.com/1007-9327/full/v20/i18/5493.htm
- DOI: https://dx.doi.org/10.3748/wjg.v20.i18.5493


