Copyright
©2014 Baishideng Publishing Group Co.
World J Gastroenterol. May 7, 2014; 20(17): 5124-5130
Published online May 7, 2014. doi: 10.3748/wjg.v20.i17.5124
Published online May 7, 2014. doi: 10.3748/wjg.v20.i17.5124
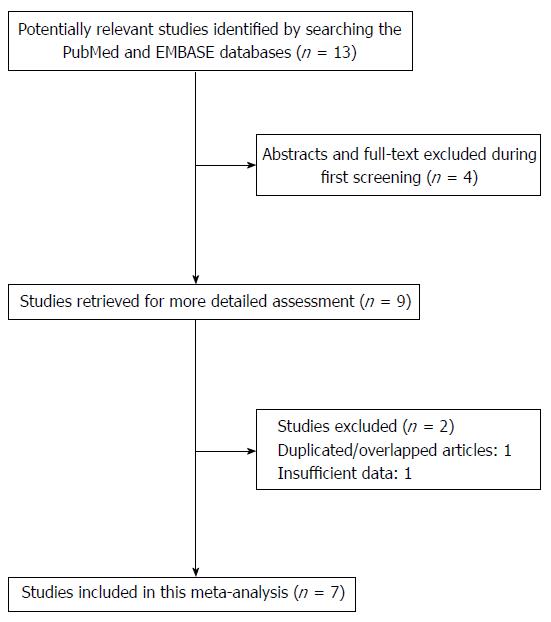
Figure 1 Flow diagram of the study selection strategy for this meta-analysis.
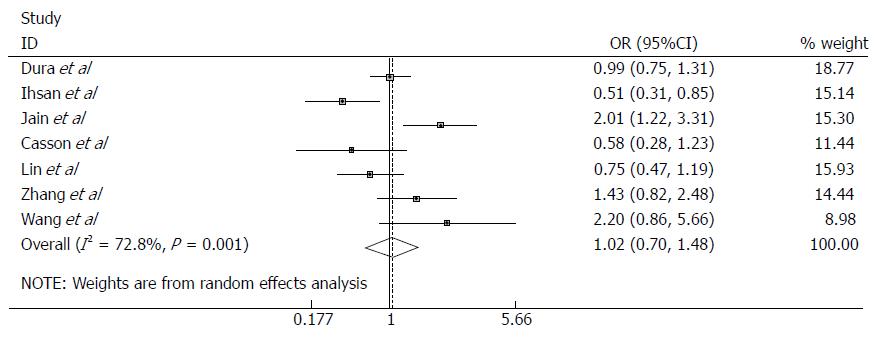
Figure 2 Odds ratios with 95%CI for the microsomal epoxide hydrolase p.
Tyr113His polymorphism and risk of esophageal cancer (Tyr/His vs Tyr/Tyr).
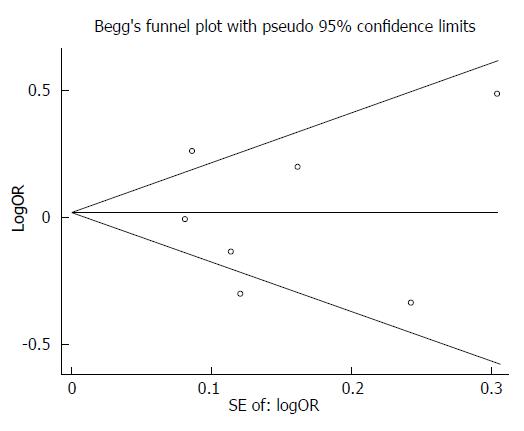
Figure 3 Funnel plot of the EPHX1 p.
Tyr113His polymorphism to determine if publication bias was present (Tyr/His vs Tyr/Tyr).
-
Citation: Li QT, Kang W, Wang M, Yang J, Zuo Y, Zhang W, Su DK. Association between esophageal cancer risk and
EPHX1 polymorphisms: A meta-analysis. World J Gastroenterol 2014; 20(17): 5124-5130 - URL: https://www.wjgnet.com/1007-9327/full/v20/i17/5124.htm
- DOI: https://dx.doi.org/10.3748/wjg.v20.i17.5124


