Copyright
©2014 Baishideng Publishing Group Co.
World J Gastroenterol. Apr 21, 2014; 20(15): 4414-4420
Published online Apr 21, 2014. doi: 10.3748/wjg.v20.i15.4414
Published online Apr 21, 2014. doi: 10.3748/wjg.v20.i15.4414
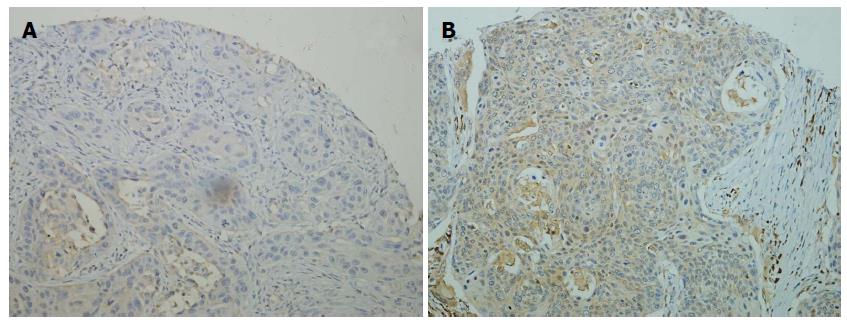
Figure 1 Representative immunohistochemical staining for caspase-3 in a primary tumor (A) and a paired metastatic lymph node (B) resected from the same patient (original magnification × 200).
Figure 2 Log10 ratio1 of caspase-3 expression in a metastatic lymph node and primary tumor for each patient.
1Log10 ratio > 0 and < 0 indicate higher and lower expression, respectively, in metastatic lymph nodes.
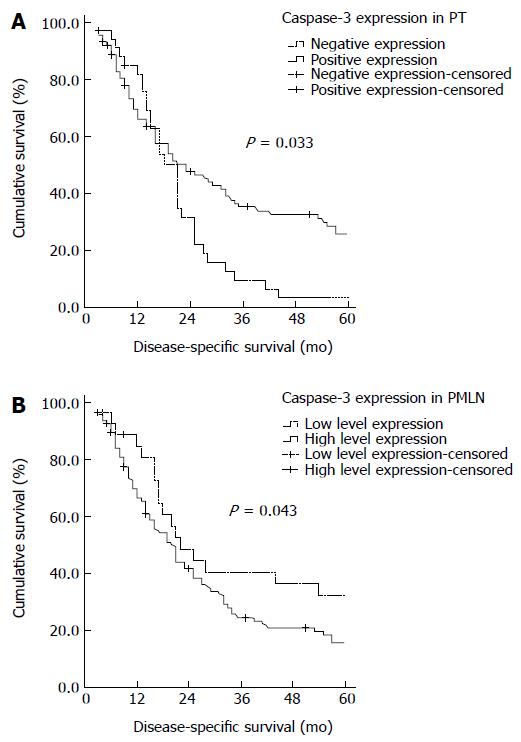
Figure 3 Disease-specific survival curves relative to caspase-3 expression in (A) primary tumor and (B) paired metastatic lymph node.
PT: Primary tumor; PMLN: Paired metastatic lymph node.
- Citation: Wang XS, Luo KJ, Bella AE, Bu SS, Wen J, Zhang SS, Hu Y. Caspase-3 expression in metastatic lymph nodes of esophageal squamous cell carcinoma is prognostic of survival. World J Gastroenterol 2014; 20(15): 4414-4420
- URL: https://www.wjgnet.com/1007-9327/full/v20/i15/4414.htm
- DOI: https://dx.doi.org/10.3748/wjg.v20.i15.4414


