Copyright
©2014 Baishideng Publishing Group Co.
World J Gastroenterol. Apr 21, 2014; 20(15): 4244-4255
Published online Apr 21, 2014. doi: 10.3748/wjg.v20.i15.4244
Published online Apr 21, 2014. doi: 10.3748/wjg.v20.i15.4244
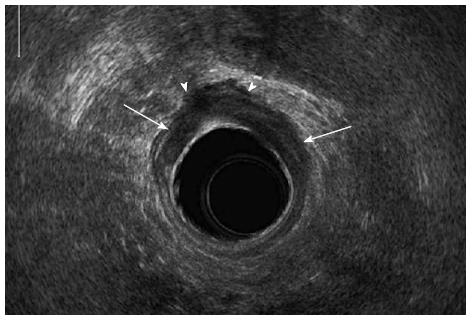
Figure 1 Endorectal ultrasound image of T3 rectal cancer.
Endorectal ultrasonography image shows a hypo-echoic mass (arrows) that extends into the echogenic mesorectal fat (arrowheads).
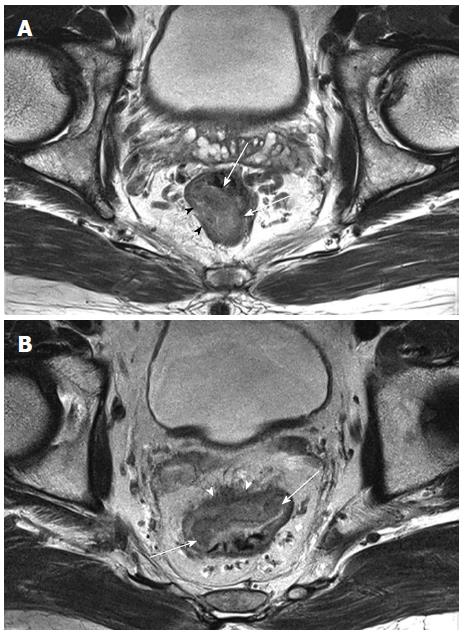
Figure 2 Stage T2 and T3 rectal cancer detected by magnetic resonance imaging.
A: T2-weighted magnetic resonance image shows an intraluminal polypoid mass (arrows) confined to the intact, hypo-intense muscularis propria (arrowheads), suggestive of a T2 cancer; B: T3 lesion is seen as a tumor (arrows) that extends through the hypo-intense muscle layer into the perirectal fat (arrowheads).
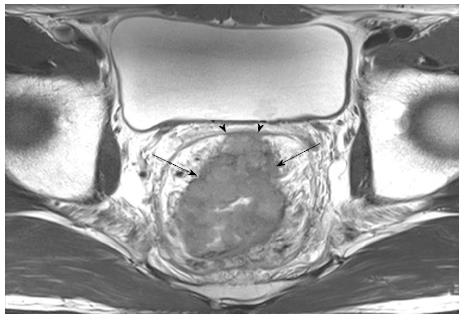
Figure 3 Mesorectal fascia invasion detected by magnetic resonance imaging.
T2-weighted magnetic resonance image shows a T3 tumor (arrows) with involvement of the mesorectal fascia (arrowheads).
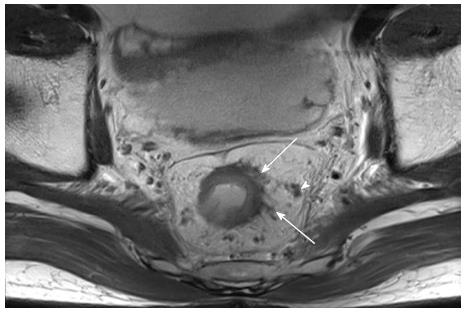
Figure 4 Over-staging due to post-chemoradiotherapy changes.
T2-weighted image obtained after chemoradiotherapy shows hypo-intense infiltration (arrows) to the perirectal fat and a spiculated lymph node (arrowheads), which was misinterpreted as a remnant T3 lesion and metastatic node. However, there was neither a residual tumor nor metastatic lymph node on the pathological examinations after surgery.
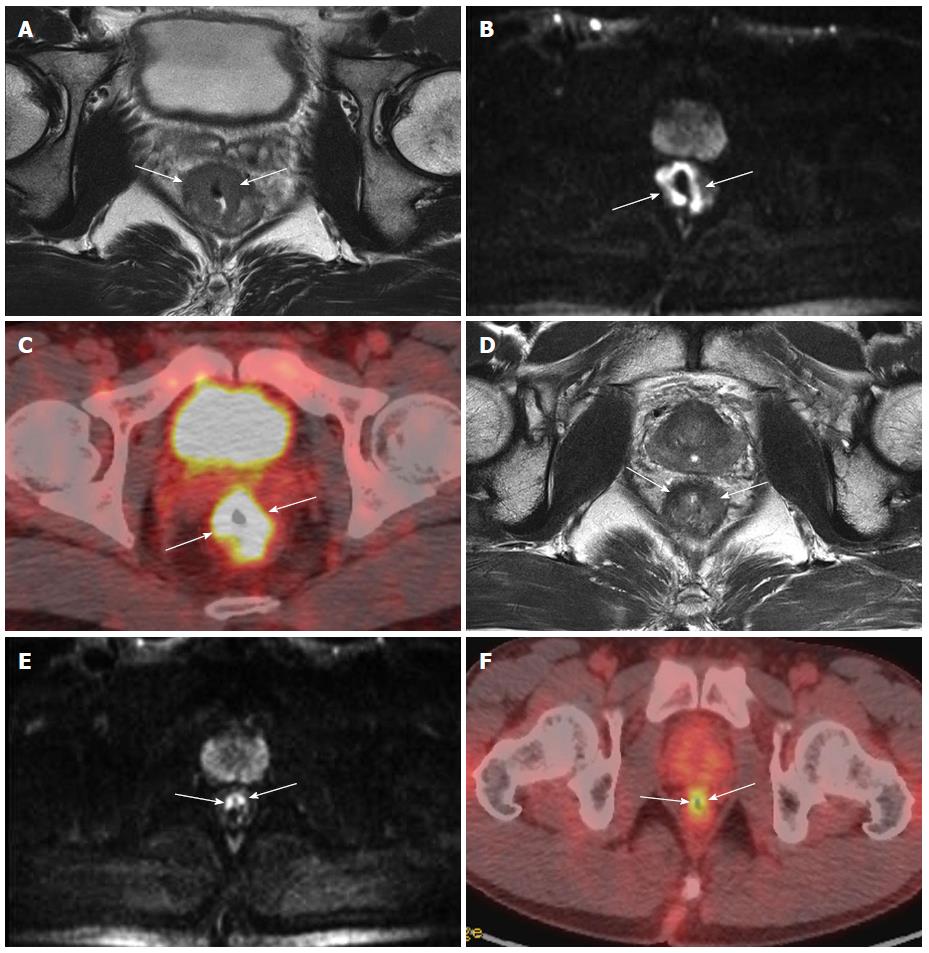
Figure 5 Combination of high-resolution magnetic resonance imaging with diffusion-weighted imaging and positron emission tomography/computed tomography for assessing tumor response after neoadjuvant chemoradiotherapy.
A-C: T2-weighted magnetic resonance image (MRI) (A), diffusion-weighted imaging (DWI) (B), and positron emission tomography (PET)/computed tomography (CT) (C) obtained before chemoradiotherapy (CRT) shows a T3 tumor (arrows) with the restricted diffusion and intense hyper-metabolism; D-F: After CRT, T2-weighted MRI (D) shows a marked decrease in the tumor size. DWI (E) shows the focal diffusion restriction confined to the rectal wall, corresponding to histological proven T2 lesion. PET/CT (F) also demonstrates the good tumor response to CRT.
- Citation: Heo SH, Kim JW, Shin SS, Jeong YY, Kang HK. Multimodal imaging evaluation in staging of rectal cancer. World J Gastroenterol 2014; 20(15): 4244-4255
- URL: https://www.wjgnet.com/1007-9327/full/v20/i15/4244.htm
- DOI: https://dx.doi.org/10.3748/wjg.v20.i15.4244


