Copyright
©2014 Baishideng Publishing Group Co.
World J Gastroenterol. Apr 14, 2014; 20(14): 4050-4058
Published online Apr 14, 2014. doi: 10.3748/wjg.v20.i14.4050
Published online Apr 14, 2014. doi: 10.3748/wjg.v20.i14.4050
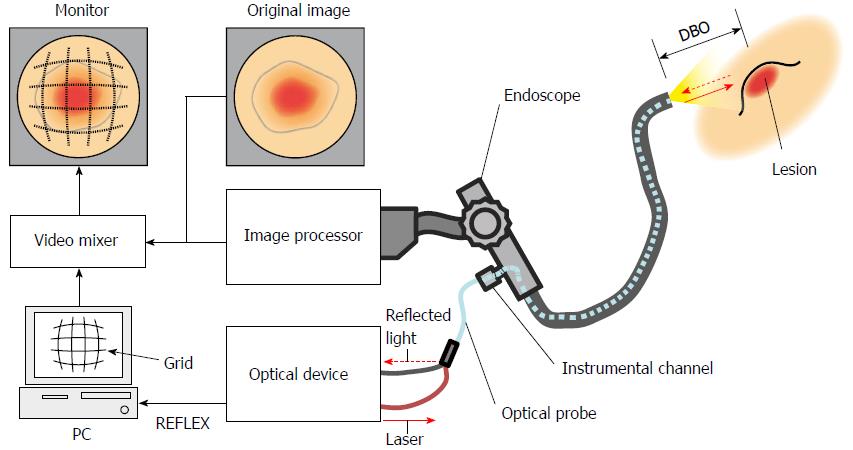
Figure 1 Diagram of the lesion size measuring system.
DBO: Distance between objects.
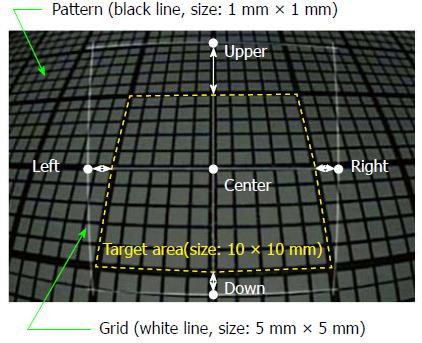
Figure 2 Endoscopic image with a 5 mm wide grid (distance between objects: 10 mm, tilt angle: 30°).
The pattern of a 1 mm square (black solid lines) was observed endoscopically (DBO: 10-40 mm, tilt angle: 0°-30°), and the 5 mm wide grid (white solid lines) was superimposed on the original image. The measurement errors (white arrows) were obtained by comparing the actual area (white dashed square line, size: 10 mm square) and four spots 5 mm away from the center of the grid (Upper, Lower, Right, Left). DBO: Distance between objects.
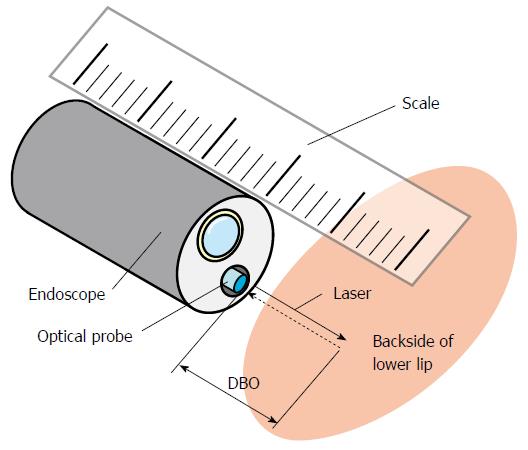
Figure 3 Image showing distance adjustment.
The scale is used to measure the distance from the endoscope tip to the inside of the lower lip directly. The probe irradiates the laser on the surface of the inside of the lower lip for DBO measurement. DBO: Distance between objects.
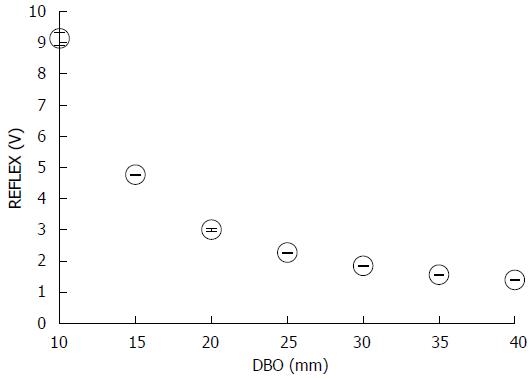
Figure 4 Difference in the amount of reflected light according to the distance between the endoscope tip and paper.
The amount of reflected light decreased exponentially in proportion to the distance between the tip and paper. DBO: Distance between objects.
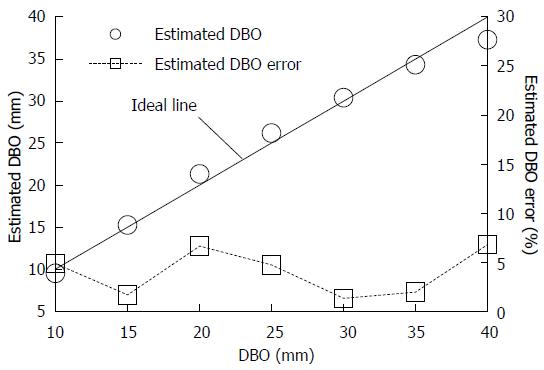
Figure 5 Comparison of the estimated distance between objects with the actual distance between objects.
When the tilt angle was 0°, the estimated DBO error (mean ± SD) was 4.0% ± 2.3%. DBO: Distance between objects.
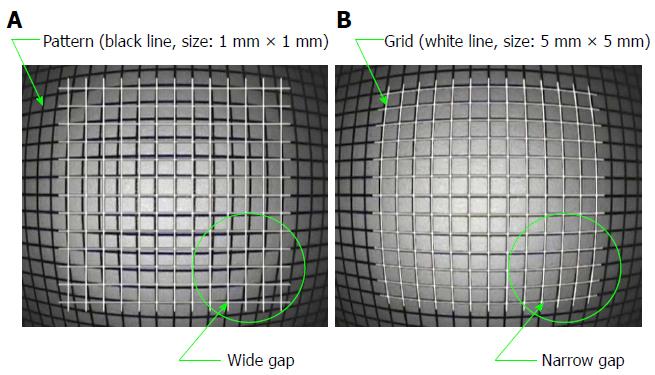
Figure 6 Distortion adjustment of grid superimposed on the original image.
A: A gap occurred between the pattern (black line) and the grid (white line) before distortion processing; B: A narrow gap occurred because the grid was distorted to match the pattern.
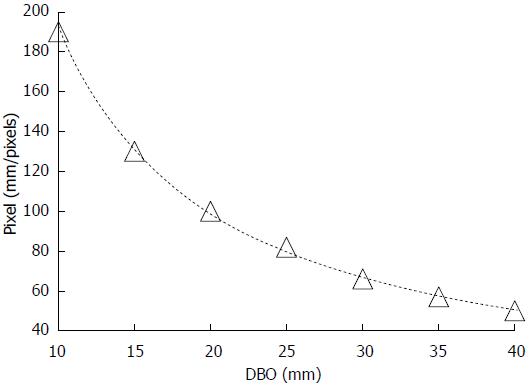
Figure 7 Relationship between the distance between objects and pixel number.
As shown in this figure, when the endoscope tip approached a target, the width of the grid increased, and when the tip was retracted, the width of the grid decreased. DBO: Distance between objects.
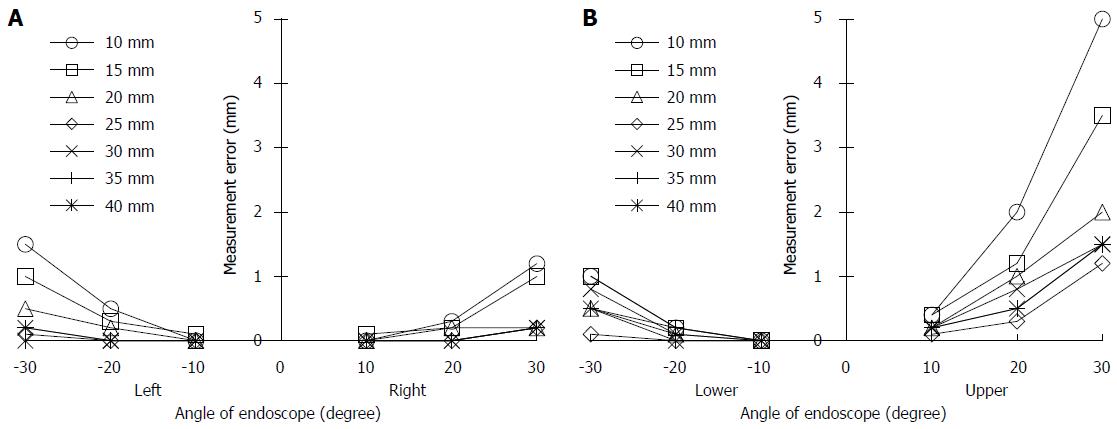
Figure 8 Evaluation results of the measurement error.
A: Left and right; B: Lower and upper.
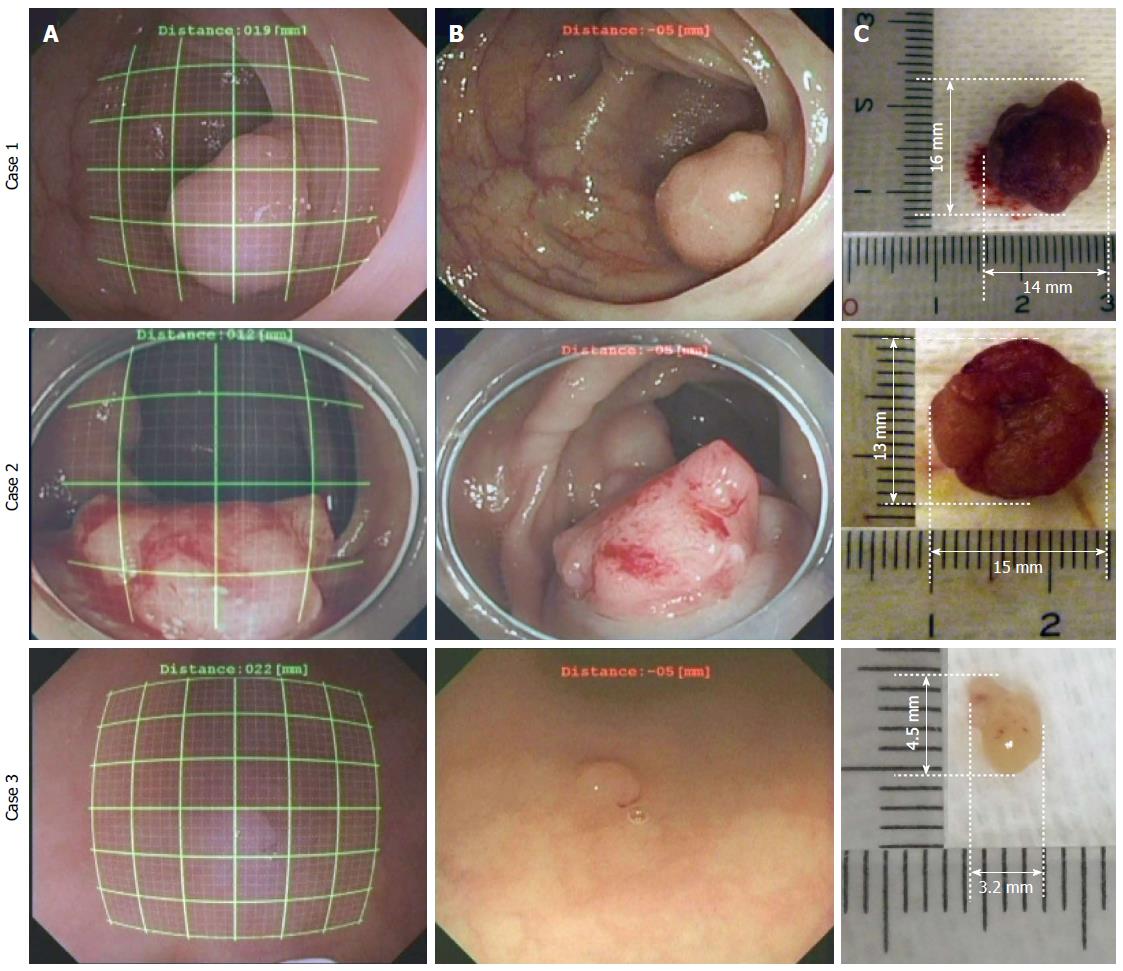
Figure 9 Results of the clinical study.
A: The monitor image that endoscopists actually see to measure the polyp size; B: Original image of endoscope; C: The polyps that were removed after measurement with the polyp size measuring system.
- Citation: Oka K, Seki T, Akatsu T, Wakabayashi T, Inui K, Yoshino J. Clinical study using novel endoscopic system for measuring size of gastrointestinal lesion. World J Gastroenterol 2014; 20(14): 4050-4058
- URL: https://www.wjgnet.com/1007-9327/full/v20/i14/4050.htm
- DOI: https://dx.doi.org/10.3748/wjg.v20.i14.4050


