Copyright
©2014 Baishideng Publishing Group Co.
World J Gastroenterol. Apr 14, 2014; 20(14): 3795-3803
Published online Apr 14, 2014. doi: 10.3748/wjg.v20.i14.3795
Published online Apr 14, 2014. doi: 10.3748/wjg.v20.i14.3795
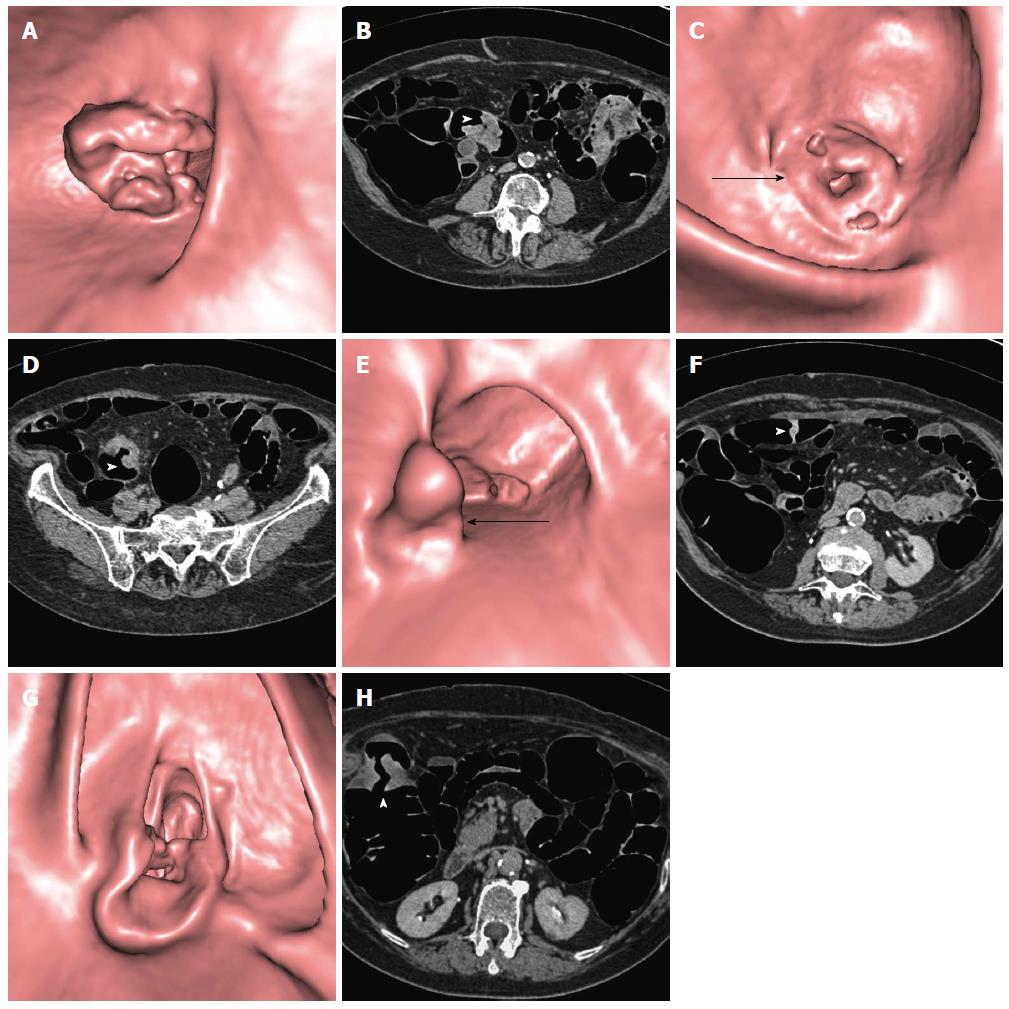
Figure 1 Computed tomography colonography performed in an 83-year-old female with incomplete colonoscopy due to stenosing adenocarcinoma of the sigmoid colon.
Computed tomography colonography (CTC) identified three other synchronous colonic tumors confirmed as adenocarcinomas at surgery. CTC endoluminal and axial source images are shown. A, B: Distal stenosing lesion of the sigmoid (arrowhead); C, D: Proximal stenosing lesion of the sigmoid (arrow and arrowhead); E, F: Vegetating lesion of the transverse colon (arrow and arrowhead); G, H: Stenosing lesion of the right flexure (arrowhead).
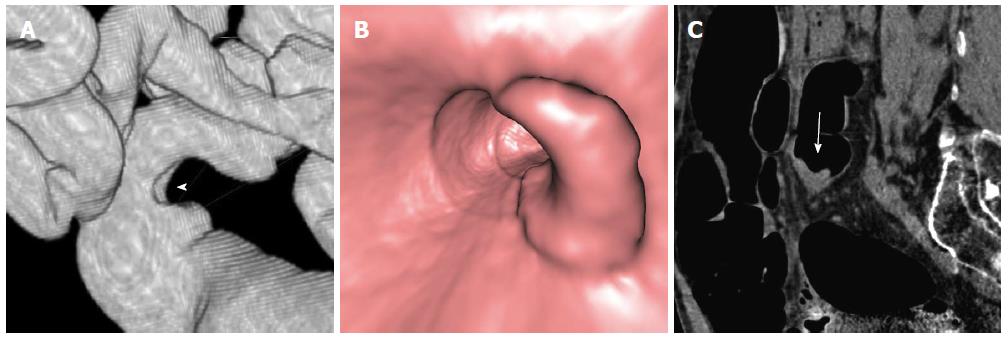
Figure 2 Stenosing adenocarcinoma of the sigmoid colon.
A: A Computed tomography colonography (CTC) oblique coronal reconstructed image depicts the lesion (arrowhead) and its nodular infiltrating margins in pericolonic fat (arrow); B: An endoluminal CTC image better shows lobulated inner borders (arrows) of the lesion; C: A surgical specimen from left hemicolectomy shows the stenosing lesion with its lobulated inner borders (arrows).
Figure 3 Computed tomography colonography of a T2 vegetating lesion of the sigmoid colon.
A: A Computed tomography colonography (CTC) SSD reconstructed image shows a trapezoid type wall deformity of the sigmoid colon (arrowhead); B: A CTC endoluminal image demonstrates that wall involvement is less than 50%of luminal circumference. C: A CTC sagittal reconstructed image shows that the lesion (arrow) has sharp margins.
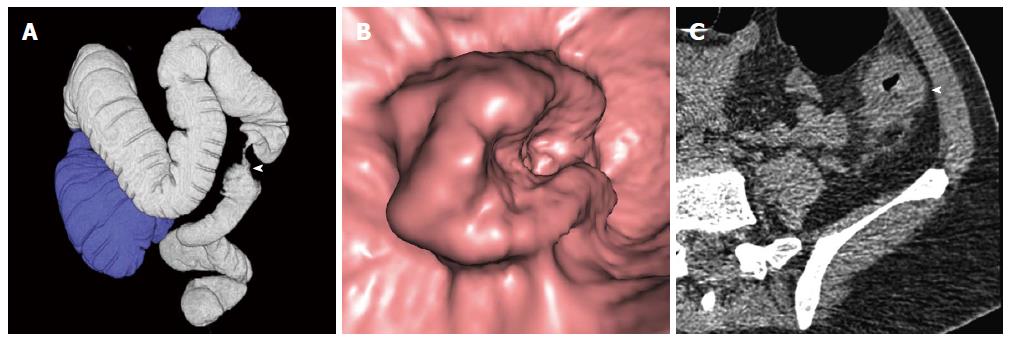
Figure 4 Computed tomography colonography of a T3 stenosing lesion of the descending colon.
A: A Computed tomography colonography (CTC) SSD reconstructed image shows an apple-core type wall deformity of the descending colon (arrowhead); B: A CTC endoluminal image demonstrates that wall involvement is more than 50% of the luminal circumference; C: A CTC axial source image shows that the lesion (arrowhead) has nodular infiltrating margins.
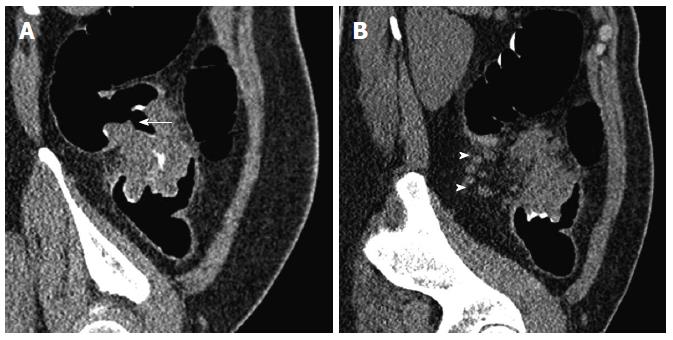
Figure 5 Computed tomography colonography of a T3 N2 stenosing computed tomography colonography of the descending colon.
A: A Computed tomography colonography (CTC) sagittal reconstructed image shows the lesion (arrow); B: A CTC sagittal reconstructed image demonstrates four subcentimetric perivisceral lymph nodes (arrowheads).
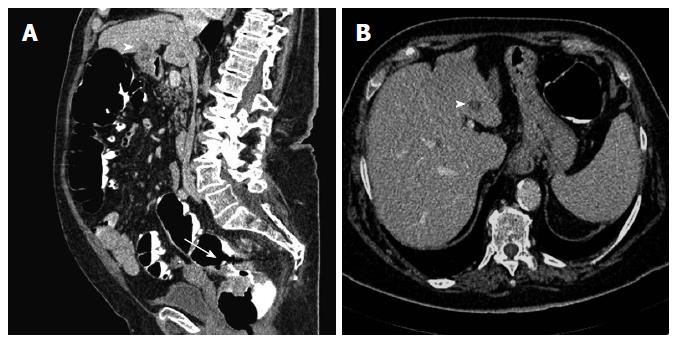
Figure 6 Computed tomography colonography of T3 M1 rectal cancer.
A: A sagittal reconstructed image shows the rectal tumor (arrow) and a hepatic metastasis appearing as a hypoattenuating focal lesion (arrowhead); B: An axial source image demonstrates that the metastatic lesion is located in the third hepatic segment (arrowhead).
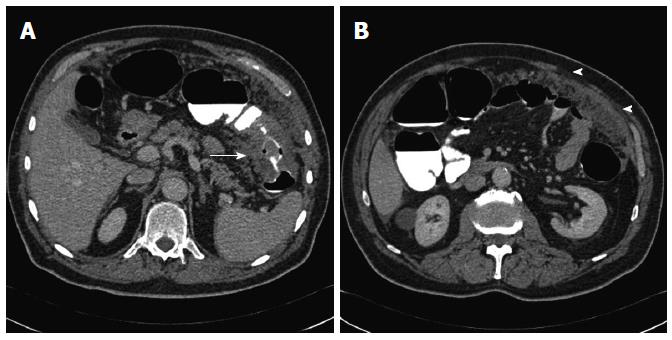
Figure 7 Computed tomography colonography of a T3 M1 stenosing Computed tomography colonography of the transverse colon.
A: A Computed tomography colonography (CTC) axial source image shows the lesion (arrow); B: A CTC axial source image depicts marked omental thickening (arrowheads) consistent with peritoneal carcinosis.
- Citation: Sali L, Falchini M, Taddei A, Mascalchi M. Role of preoperative CT colonography in patients with colorectal cancer. World J Gastroenterol 2014; 20(14): 3795-3803
- URL: https://www.wjgnet.com/1007-9327/full/v20/i14/3795.htm
- DOI: https://dx.doi.org/10.3748/wjg.v20.i14.3795


