Copyright
©2014 Baishideng Publishing Group Co.
World J Gastroenterol. Mar 28, 2014; 20(12): 3312-3319
Published online Mar 28, 2014. doi: 10.3748/wjg.v20.i12.3312
Published online Mar 28, 2014. doi: 10.3748/wjg.v20.i12.3312
Figure 1 Expression of collagen 1, α-smooth muscle actin and CD34 in biliary atresia vs control livers.
Staining of collagen 1 (A, B), α-SMA (C, D) and CD34 (E, F) by immunohistochemistry. Figure A, C and E represent liver biopsies of a BA patient, who underwent Kasai portoenterostomy at the age of 54 d and figure B, D and F are liver biopsies obtained from a deceased donor (× 100 magnification). The same area of the histological tissue section is illustrated after immunohistochemistry for both subjects, respectively. Portal tracts (pt) stain intensively with collagen 1 and marked collagen 1 positive septaes (arrows) protrude towards central vein (cv) (A). In control liver collagen 1 staining is limited to portal area and endothelial lining of central vein (B). α-SMA staining shows strong immunoreactivity both in portal areas (pt) and along perisinusoidal spaces (arrows) (C), whereas in control specimen a faint α-SMA staining can be seen in biliary epithelial cells (D). Marked increase in CD34 staining is observed on portal (arrow) and centrizonal (arrowhead) area on liver biopsy of BA patient (E) compared with control (F). Summary of collagen 1 (G), α-SMA (H) and CD34 (I) immunohistochemistry in BA patients and controls. Collagen 1, α-SMA and CD34 were markedly overexpressed in BA at the time of Kasai portoenterostomy compared with controls. The results are expressed as proportion of the antibody-positive area. The box represents interquartile range, line across the box median, and the whiskers 90th percentile range. α-SMA: α-smooth muscle actin; BA: Biliary atresia.
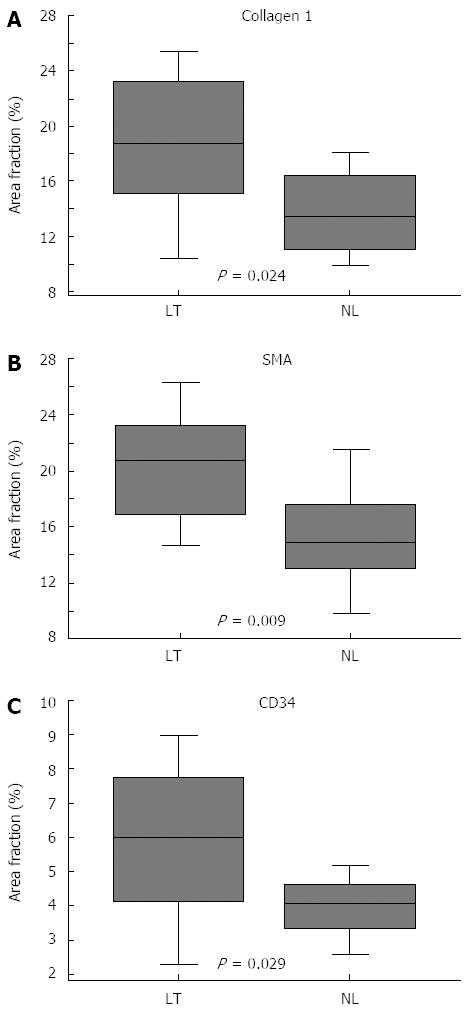
Figure 2 Comparison of collagen 1 (A), α-smooth muscle actin (B) and CD34 (C) staining by immunohistochemistry between patients, who received liver transplant by two years of age and native liver survivors.
The results are expressed as proportion of the antibody-positive area. All of the studied proteins were overexpressed at the time of Kasai portoenterostomy in patients, who were transplanted by two years. The box represents interquartile range, line across the box median, and the whiskers 90th percentile range. NL: Native liver; LT: Liver transplant; α-SMA: α-smooth muscle actin.
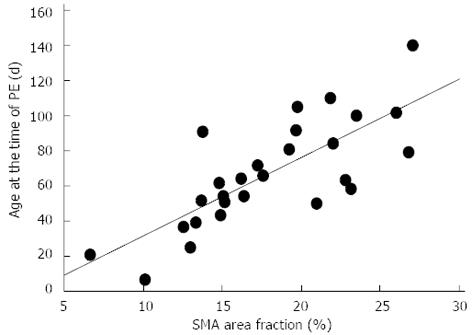
Figure 3 Correlation between the age at the time of portoenterostomy and α-smooth muscle actin expression.
A significant correlation was seen using Spearman’s rank correlation test (r = 0.758, P < 0.0001). α-SMA: α-smooth muscle actin; PE: Portoenterostomy.
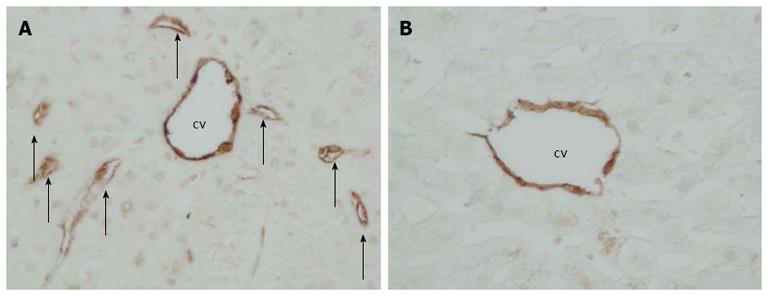
Figure 4 High magnification (× 400) images of CD34 immunohistochemistry on centrizonal region.
There are multiple microvessels (arrows) around central vein (cv) in biliary atresia patient who underwent Kasai portoenterostomy at the age of 51 d (A) whereas only endothelium of central vein is stained in control liver (B).
- Citation: Suominen JS, Lampela H, Heikkilä P, Lohi J, Jalanko H, Pakarinen MP. Myofibroblastic cell activation and neovascularization predict native liver survival and development of esophageal varices in biliary atresia. World J Gastroenterol 2014; 20(12): 3312-3319
- URL: https://www.wjgnet.com/1007-9327/full/v20/i12/3312.htm
- DOI: https://dx.doi.org/10.3748/wjg.v20.i12.3312


