Copyright
©2014 Baishideng Publishing Group Co.
World J Gastroenterol. Mar 28, 2014; 20(12): 3301-3311
Published online Mar 28, 2014. doi: 10.3748/wjg.v20.i12.3301
Published online Mar 28, 2014. doi: 10.3748/wjg.v20.i12.3301
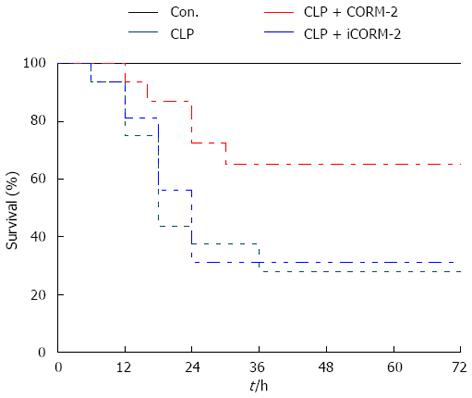
Figure 1 Effect of carbon monoxide-releasing molecule II on survival of septic mice.
Mice were challenged with cecal ligation and puncture (CLP) and treated with tricarbonyldi- chlororuthenium (II) dimer (CORM-2) or iCORM-2 as described in the Methods section. All mice had access to water and food. Mouse survival was monitored six times daily for up to 72 h after surgery. Data are shown as the percentage of surviving animals. The survival rate of mice in the CLP group was substantially low, and was only 42% at 24 h and 26% at 48 h postoperatively. In contrast, the survival rate of mice in the CORM-2 group was significantly increased after the CORM-2 intervention, and was 73% at 24 h and 66% at 48 h postoperatively (P < 0.05). Moreover, at 72 h postoperatively, 66% of the mice were still alive.
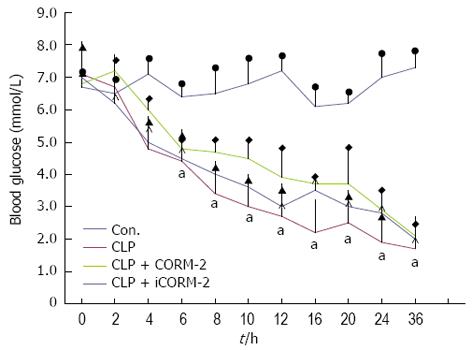
Figure 2 Effect of carbon monoxide-releasing molecule II on blood glucose in septic mice.
Mice were challenged with cecal ligation and puncture (CLP) and treated with tricarbonyldichlororuthenium (II) dimer (CORM-2) or iCORM-2 as described in the Methods section. Serum glucose concentrations were assessed in all groups of mice preoperatively, and at 1, 2, 4, 6, 8, 10, 12, 16, 20, 24 and 36 h postoperatively. Blood glucose levels in the CLP group decreased to 30%-50% of the normal controls, and remained at these low levels for more than 36 h postoperatively. However, no changes were found in blood glucose levels in the CLP mice after intervention with CORM-2. Results are mean ± SD, aP < 0.05 vs sham mice.
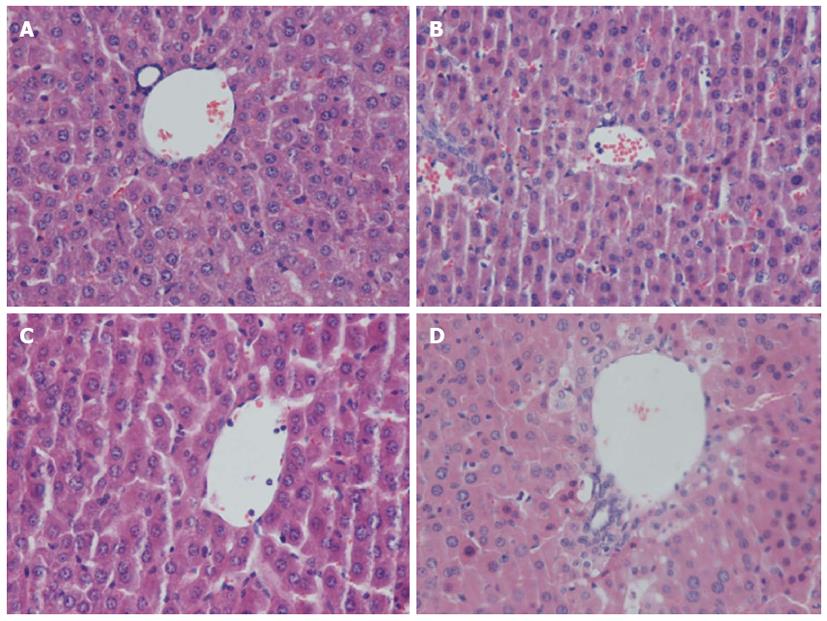
Figure 3 Effect of carbon monoxide-releasing molecule II on liver injury in septic mice.
Mice were challenged with cecal ligation and puncture (CLP) and treated with tricarbonyldichlororuthenium (II) dimer (CORM-2) or iCORM-2 as described in the Methods section. Morphologic characteristics at 24 h after CLP were observed under light microscopy with hematoxylin and eosin (HE) staining. Liver specimens from mice in the CLP group showed sinusoidal dilatation and congestion, hepatocellular swelling, vacuolar changes in partial hepatocytes, and neutrophil infiltration. However, in the CLP + CORM-2 group, hepatocellular damage was obviously less severe and the extent of hepatic neutrophil infiltration was reduced. A: Sham; B: CLP; C: CLP + CORM-2; D: CLP + iCORM-2.
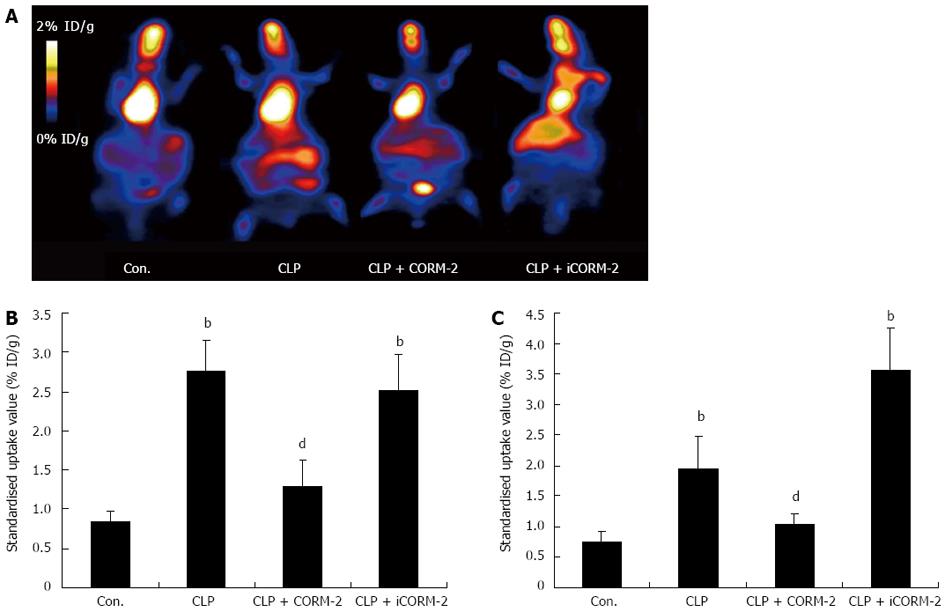
Figure 4 Effect of carbon monoxide-releasing molecule II on fludeoxyglucose uptake in the liver of septic mice.
Mice were challenged with cecal ligation and puncture (CLP) and treated with tricarbonyldichlororuthenium (II) dimer (CORM-2) or iCORM-2 as described in the Methods section. 18F-fludeoxyglucose (FDG) was administered by tail vein injection at a dose of 20 μCi followed by micro-positron emission tomography scanning and measurement of 18F-FDG biodistribution. Compared with the normal control group, the CLP group of mice showed significant increases in the level of hepatic glucose metabolism, and these increases were suppressed by CORM-2 intervention. A: Representative images of liver FDG uptake; B: The mean standardized radioactive uptake values in liver tissue; C: Quantification of 18F-FDG biodistribution. bP < 0.01 vs sham mice; dP < 0.01 vs CLP mice.
Figure 5 Effect of carbon monoxide-releasing molecule II on plasma aspartate aminotransferase and alanine aminotransferase activities in septic mice.
Mice were challenged with cecal ligation and puncture (CLP) and treated with tricarbonyldichlororuthenium (II) dimer (CORM-2) or iCORM-2 as described in the Methods section. Plasma aspartate aminotransferase (AST) and alanine aminotransferase (ALT) activities at 24 h after surgery were determined. Plasma activities of ALT (A) and AST (B) were higher in CLP-challenged mice compared with sham mice, whereas ALT and AST activities were markedly decreased after administration of CORM-2. Results are mean ± SD, bP < 0.01 vs sham mice; aP < 0.05 vs CLP mice.
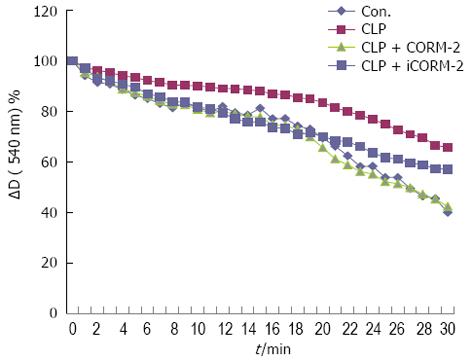
Figure 6 Effect of carbon monoxide-releasing molecule II on hepatic mitochondrial function in septic mice.
Mice were challenged with cecal ligation and puncture (CLP) and treated with tricarbonyldichlororuthenium (II) dimer (CORM-2) or iCORM-2 as described in the Methods section. Isolated mitochondria were resuspended in the assay buffer. Ca2+-induced mitochondrial swelling was assayed by the decrease in absorbance at 540 nm. The CLP group of mice had significant hepatic mitochondrial swelling with severely damaged mitochondrial function. Following CORM-2 intervention, the extent of hepatic mitochondrial swelling was reduced and mitochondrial function was clearly protected (P < 0.05 vs CLP mice). The curves represent typical recordings from experiments of at least three different mitochondrial preparations.
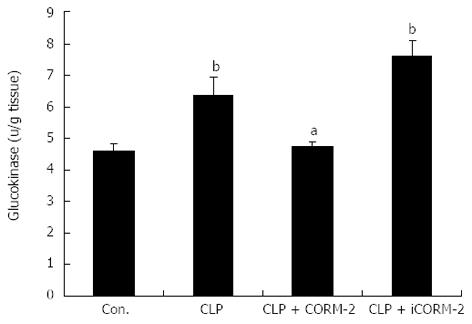
Figure 7 Effect of carbon monoxide-releasing molecule II on hepatic glucokinase activity level in septic mice.
Mice were challenged with cecal ligation and puncture (CLP) and treated with tricarbonyldichlororuthenium (II) dimer (CORM-2) or iCORM-2 as described in the Methods section. Hepatic glucokinase activities were assayed by enzyme-linked immunosorbent assay. Compared with the sham group, the CLP group of mice showed a significant increase in hepatic glucokinase (GK) activity. In contrast, the CLP + CORM-2 group showed significantly reduced hepatic GK activity. Results are mean ± SD, bP < 0.01 vs sham mice; aP < 0.05 vs CLP mice.
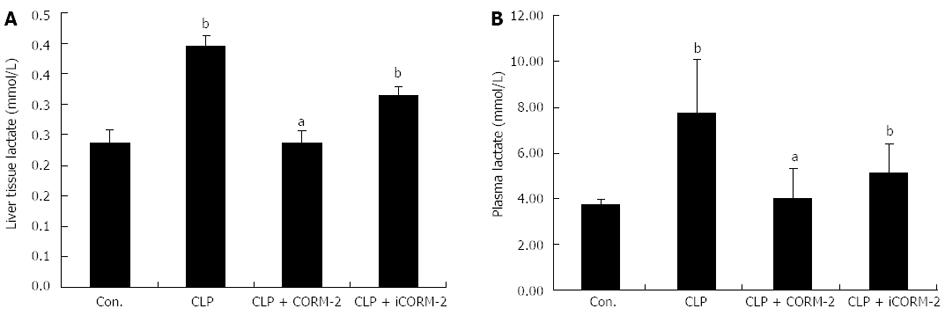
Figure 8 Effect of carbon monoxide-releasing molecule II on hepatic lactate production in septic mice.
Mice were challenged with cecal ligation and puncture (CLP) and treated with tricarbonyldichlororuthenium (II) dimer (CORM-2) or iCORM-2 as described in the Methods section. Lactate production in hepatic homogenates (A) and plasma (B) were assessed 24 h after CLP injury. When compared with the sham group, the CLP groups had significantly higher levels of lactic acid. After CORM-2 intervention, lactic acid levels in plasma and hepatic homogenates declined significantly. Results are presented as mean ± SD. bP < 0.01 vs sham mice; aP < 0.05 vs CLP mice.
- Citation: Liang F, Cao J, Qin WT, Wang X, Qiu XF, Sun BW. Regulatory effect and mechanisms of carbon monoxide-releasing molecule II on hepatic energy metabolism in septic mice. World J Gastroenterol 2014; 20(12): 3301-3311
- URL: https://www.wjgnet.com/1007-9327/full/v20/i12/3301.htm
- DOI: https://dx.doi.org/10.3748/wjg.v20.i12.3301


