Copyright
©2014 Baishideng Publishing Group Co.
World J Gastroenterol. Mar 14, 2014; 20(10): 2673-2680
Published online Mar 14, 2014. doi: 10.3748/wjg.v20.i10.2673
Published online Mar 14, 2014. doi: 10.3748/wjg.v20.i10.2673
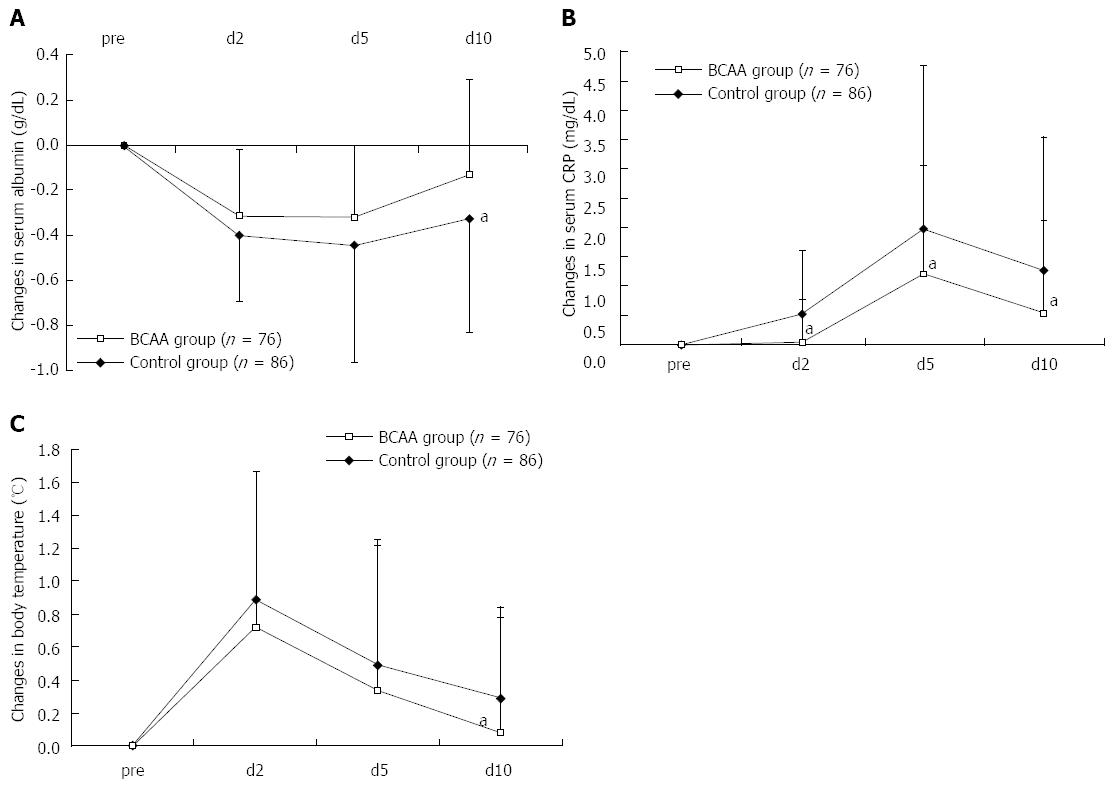
Figure 1 Changes in serum albumin (A), C-reactive protein (B) and body temperature (C) levels in comparison to the baseline level after transarterial chemoembolization.
Data were assessed using student’s t test (mean ± SD). aP < 0.05 vs control group. CRP: C-reactive protein; BCAA: Branched-chain amino acids.
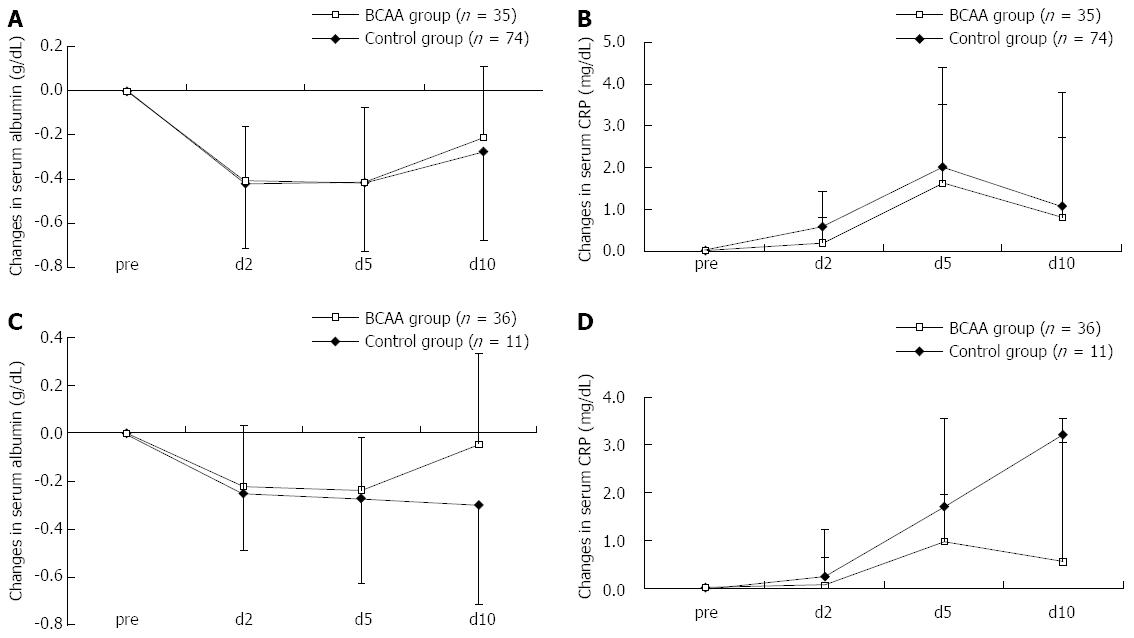
Figure 2 Comparison in Child A and B patients with serum albumin and C-reactive protein levels after transarterial chemoembolization.
The analysis revealed a tendency for Child A patients to show a faster recovery in serum albumin level (A) and suppression of C-reactive protein (CRP) elevation (B). The analysis revealed a tendency for Child B patients to show a faster recovery in serum albumin level (C) and suppression of CRP elevation (D). Data were assessed using student’s t test (mean ± SD). BCAA: Branched-chain amino acids.
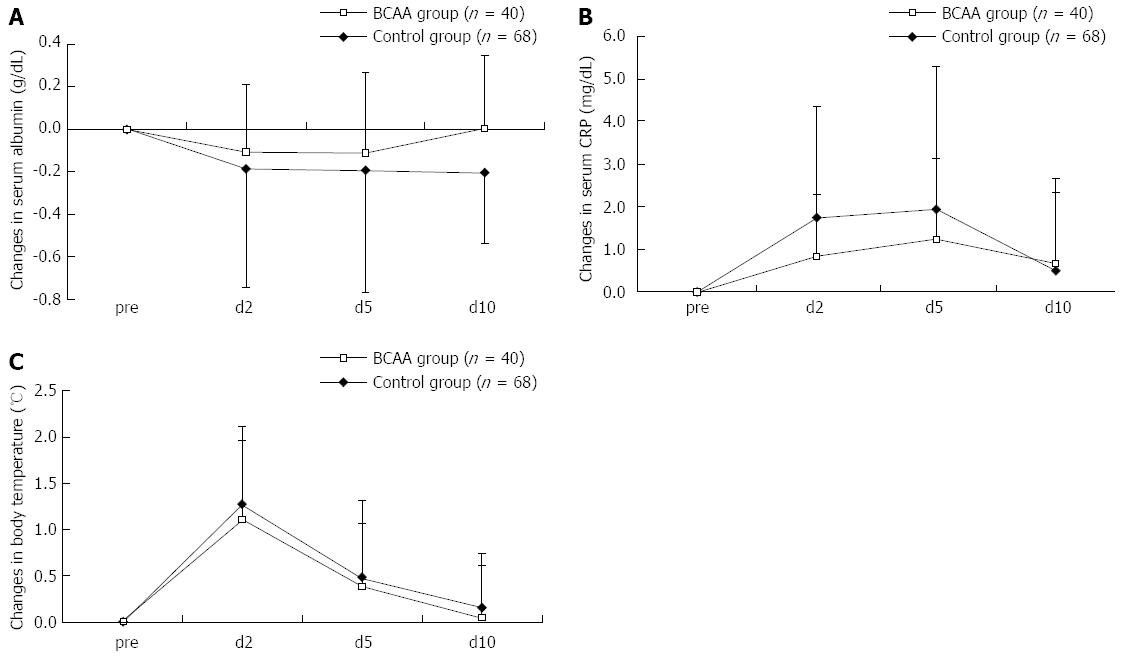
Figure 3 Changes in serum albumin (A), C-reactive protein (B) and body temperature (C) levels in comparison to the baseline level after radiofrequency ablation.
Data were assessed using student’s t test (mean ± SD). aP < 0.05 vs control group. CRP: C-reactive protein; BCAA: Branched-chain amino acids.
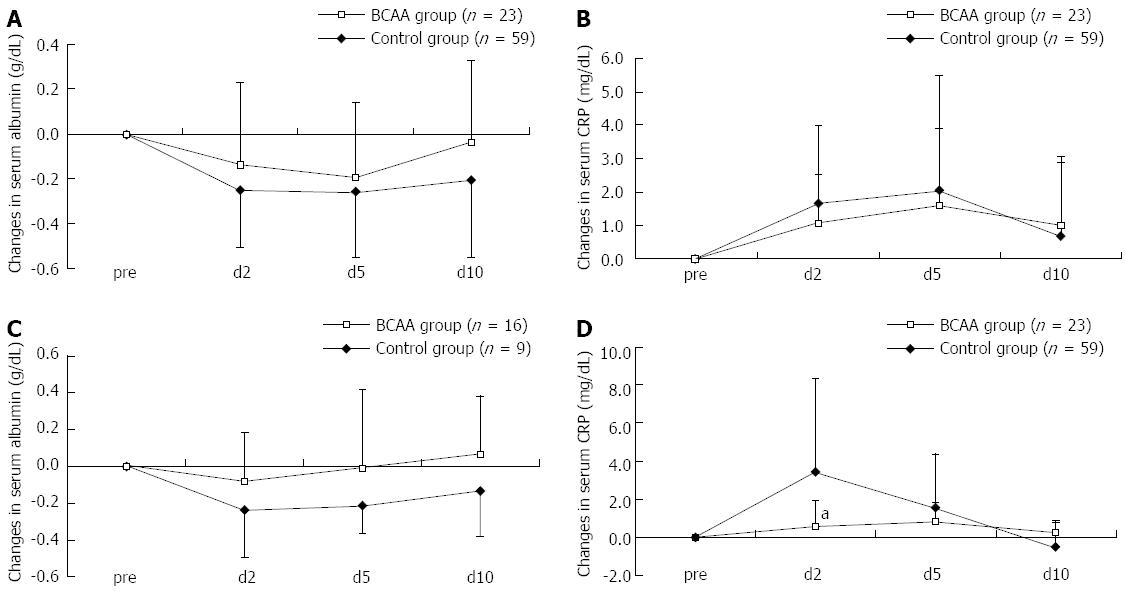
Figure 4 Comparison in Child A and B patients with serum albumin and C-reactive protein levels after radiofrequency ablation.
A: A faster recovery of serum albumin level was noted in Child A; B: No difference of C-reactive protein (CRP) was noted in changes in Child A; C: A faster recovery of serum albumin level was noted in Child B; D: A significant difference of CRP was noted in changes in Child B. Data were assessed using student’s t test (mean ± SD). aP < 0.05 vs control group. BCAA: Branched-chain amino acids.
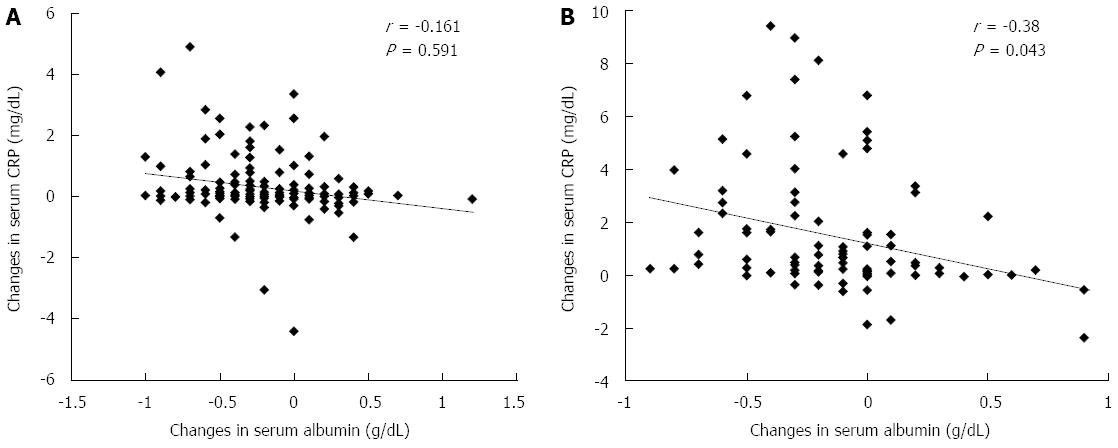
Figure 5 Relationship between Δalbumin (day 2) and ΔC-reactive protein (day 10).
A: Transarterial chemoembolization; B: Radiofrequency ablation correlation between each variable was tested using Pearson’s correlation coefficient.
- Citation: Ishihara T, Iwasa M, Tanaka H, Kaito M, Ikoma J, Shibata T, Takei Y. Effect of branched-chain amino acids in patients receiving intervention for hepatocellular carcinoma. World J Gastroenterol 2014; 20(10): 2673-2680
- URL: https://www.wjgnet.com/1007-9327/full/v20/i10/2673.htm
- DOI: https://dx.doi.org/10.3748/wjg.v20.i10.2673


